These functions allow you to specify your own set of mappings from levels in the data to aesthetic values.
Usage
scale_colour_manual(
  ...,
  values,
  aesthetics = "colour",
  breaks = waiver(),
  na.value = "grey50"
)

scale_fill_manual(
  ...,
  values,
  aesthetics = "fill",
  breaks = waiver(),
  na.value = "grey50"
)

scale_size_manual(
  ...,
  values,
  breaks = waiver(),
  na.value = NA,
  aesthetics = "size"
)

scale_shape_manual(
  ...,
  values,
  breaks = waiver(),
  na.value = NA,
  aesthetics = "shape"
)

scale_linetype_manual(
  ...,
  values,
  breaks = waiver(),
  na.value = NA,
  aesthetics = "linetype"
)

scale_linewidth_manual(
  ...,
  values,
  breaks = waiver(),
  na.value = NA,
  aesthetics = "linewidth"
)

scale_alpha_manual(
  ...,
  values,
  breaks = waiver(),
  na.value = NA,
  aesthetics = "alpha"
)

scale_discrete_manual(aesthetics, ..., values, breaks = waiver())
Arguments
- ...
Arguments passed on to
discrete_scalelimitsOne of:
NULLto use the default scale valuesA character vector that defines possible values of the scale and their order
A function that accepts the existing (automatic) values and returns new ones. Also accepts rlang lambda function notation.
dropShould unused factor levels be omitted from the scale? The default,
TRUE, uses the levels that appear in the data;FALSEincludes the levels in the factor. Please note that to display every level in a legend, the layer should useshow.legend = TRUE.na.translateUnlike continuous scales, discrete scales can easily show missing values, and do so by default. If you want to remove missing values from a discrete scale, specify
na.translate = FALSE.nameThe name of the scale. Used as the axis or legend title. If
waiver(), the default, the name of the scale is taken from the first mapping used for that aesthetic. IfNULL, the legend title will be omitted.minor_breaksOne of:
NULLfor no minor breakswaiver()for the default breaks (none for discrete, one minor break between each major break for continuous)A numeric vector of positions
A function that given the limits returns a vector of minor breaks. Also accepts rlang lambda function notation. When the function has two arguments, it will be given the limits and major break positions.
labelsOne of the options below. Please note that when
labelsis a vector, it is highly recommended to also set thebreaksargument as a vector to protect against unintended mismatches.NULLfor no labelswaiver()for the default labels computed by the transformation objectA character vector giving labels (must be same length as
breaks)An expression vector (must be the same length as breaks). See ?plotmath for details.
A function that takes the breaks as input and returns labels as output. Also accepts rlang lambda function notation.
guideA function used to create a guide or its name. See
guides()for more information.callThe
callused to construct the scale for reporting messages.superThe super class to use for the constructed scale
- values
a set of aesthetic values to map data values to. The values will be matched in order (usually alphabetical) with the limits of the scale, or with
breaksif provided. If this is a named vector, then the values will be matched based on the names instead. Data values that don't match will be givenna.value.- aesthetics
Character string or vector of character strings listing the name(s) of the aesthetic(s) that this scale works with. This can be useful, for example, to apply colour settings to the
colourandfillaesthetics at the same time, viaaesthetics = c("colour", "fill").- breaks
One of:
NULLfor no breakswaiver()for the default breaks (the scale limits)A character vector of breaks
A function that takes the limits as input and returns breaks as output
- na.value
The aesthetic value to use for missing (
NA) values
Details
The functions scale_colour_manual(), scale_fill_manual(), scale_size_manual(),
etc. work on the aesthetics specified in the scale name: colour, fill, size,
etc. However, the functions scale_colour_manual() and scale_fill_manual() also
have an optional aesthetics argument that can be used to define both colour and
fill aesthetic mappings via a single function call (see examples). The function
scale_discrete_manual() is a generic scale that can work with any aesthetic or set
of aesthetics provided via the aesthetics argument.
Color Blindness
Many color palettes derived from RGB combinations (like the "rainbow" color
palette) are not suitable to support all viewers, especially those with
color vision deficiencies. Using viridis type, which is perceptually
uniform in both colour and black-and-white display is an easy option to
ensure good perceptive properties of your visualizations.
The colorspace package offers functionalities
to generate color palettes with good perceptive properties,
to analyse a given color palette, like emulating color blindness,
and to modify a given color palette for better perceptivity.
For more information on color vision deficiencies and suitable color choices see the paper on the colorspace package and references therein.
See also
The documentation for differentiation related aesthetics.
The documentation on colour aesthetics.
The manual scales and manual colour scales sections of the online ggplot2 book.
Other size scales: scale_size(), scale_size_identity().
Other shape scales: scale_shape(), scale_shape_identity().
Other linetype scales: scale_linetype(), scale_linetype_identity().
Other alpha scales: scale_alpha(), scale_alpha_identity().
Other colour scales:
scale_alpha(),
scale_colour_brewer(),
scale_colour_continuous(),
scale_colour_discrete(),
scale_colour_gradient(),
scale_colour_grey(),
scale_colour_hue(),
scale_colour_identity(),
scale_colour_steps(),
scale_colour_viridis_d()
Examples
p <- ggplot(mtcars, aes(mpg, wt)) +
geom_point(aes(colour = factor(cyl)))
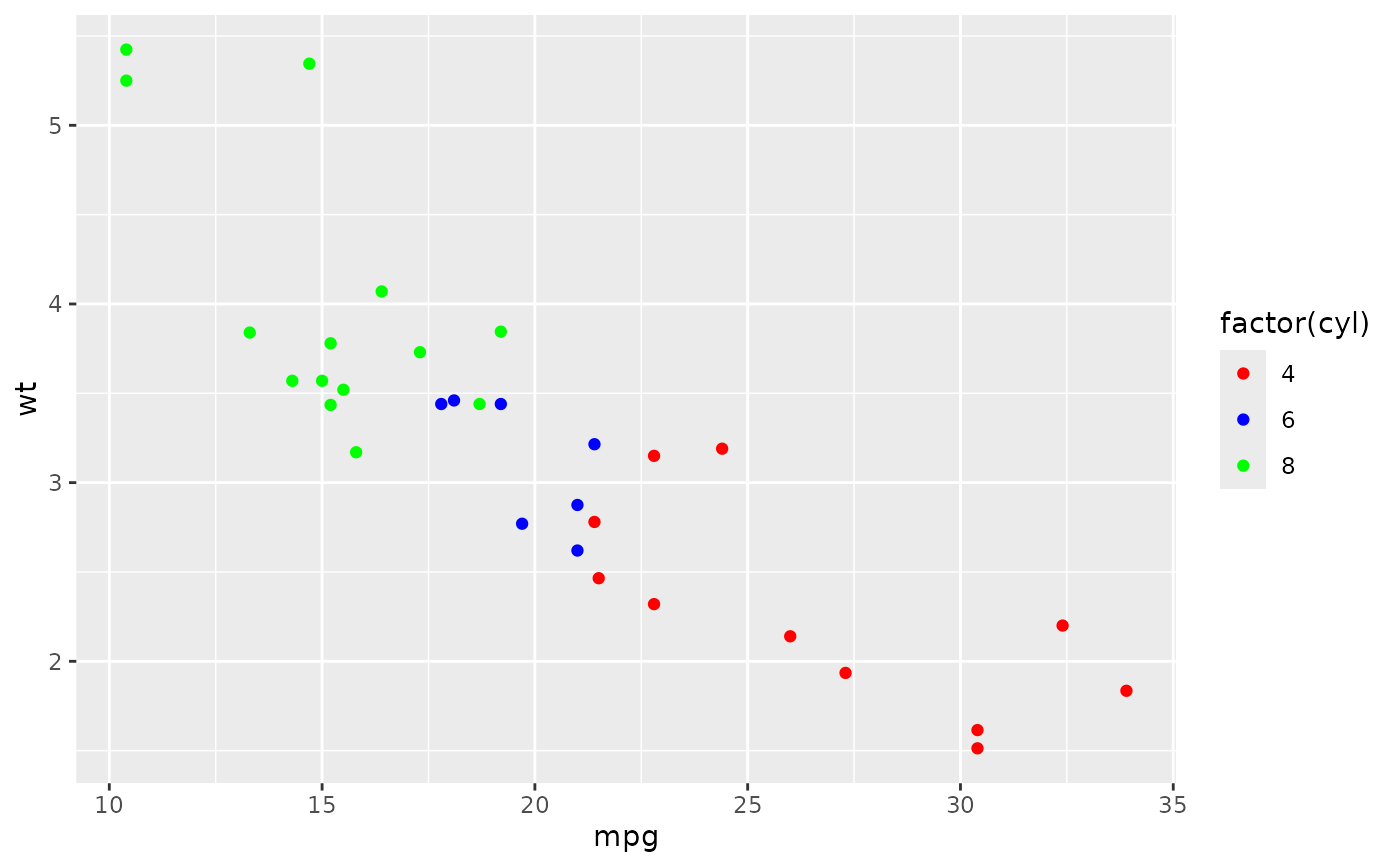
p + scale_colour_manual(values = c("red", "blue", "green"))
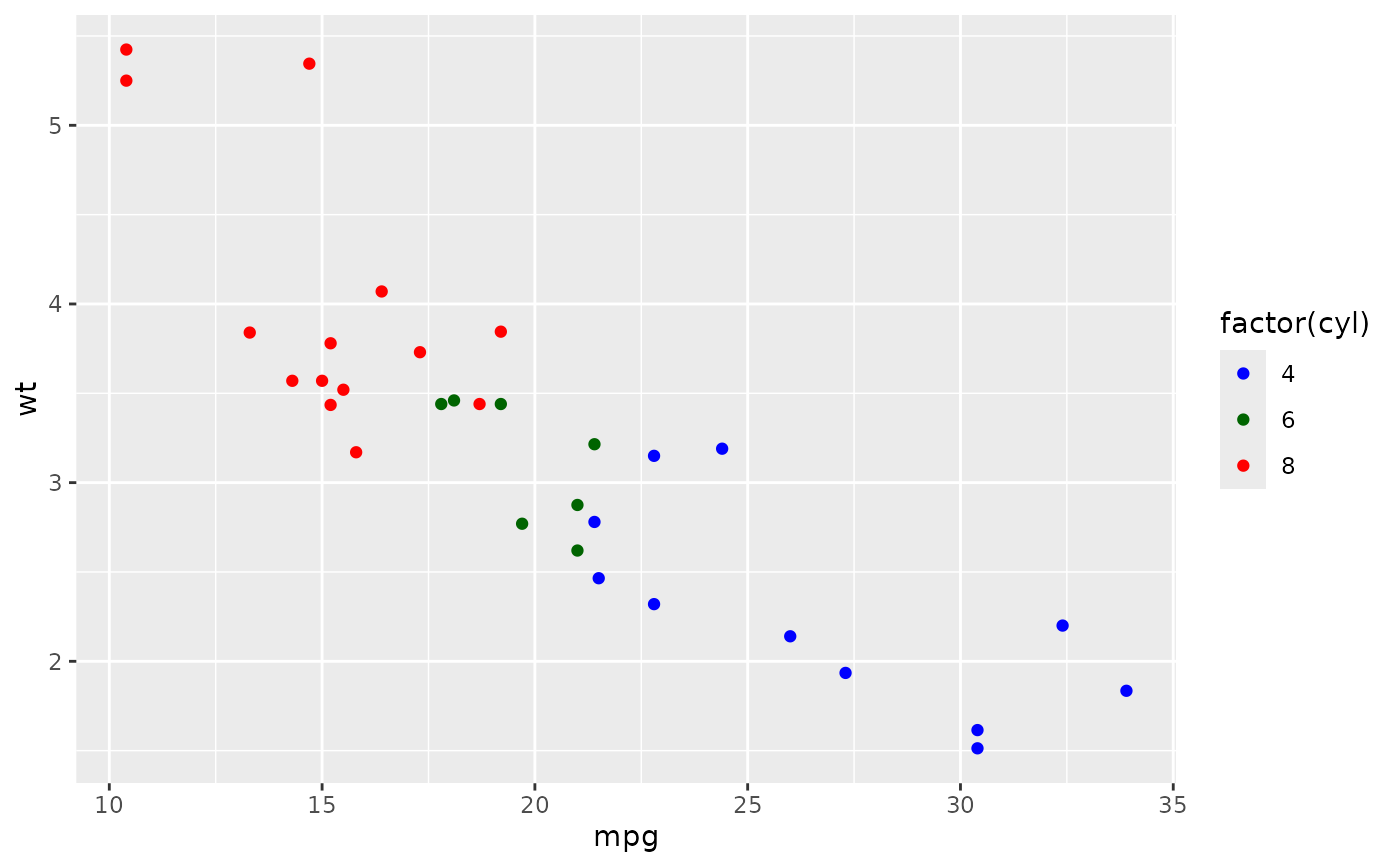
 # It's recommended to use a named vector
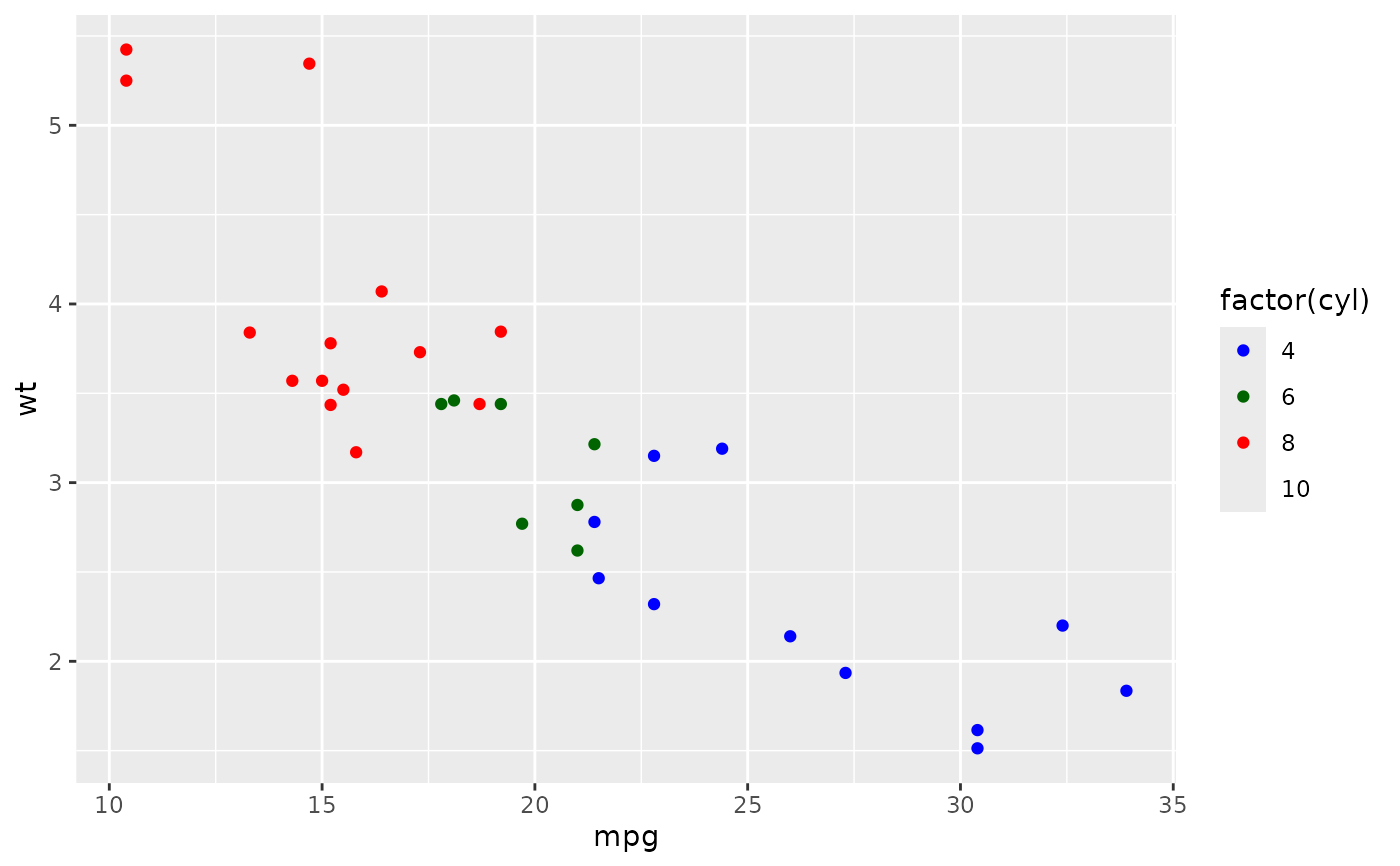
cols <- c("8" = "red", "4" = "blue", "6" = "darkgreen", "10" = "orange")
p + scale_colour_manual(values = cols)
# It's recommended to use a named vector
cols <- c("8" = "red", "4" = "blue", "6" = "darkgreen", "10" = "orange")
p + scale_colour_manual(values = cols)
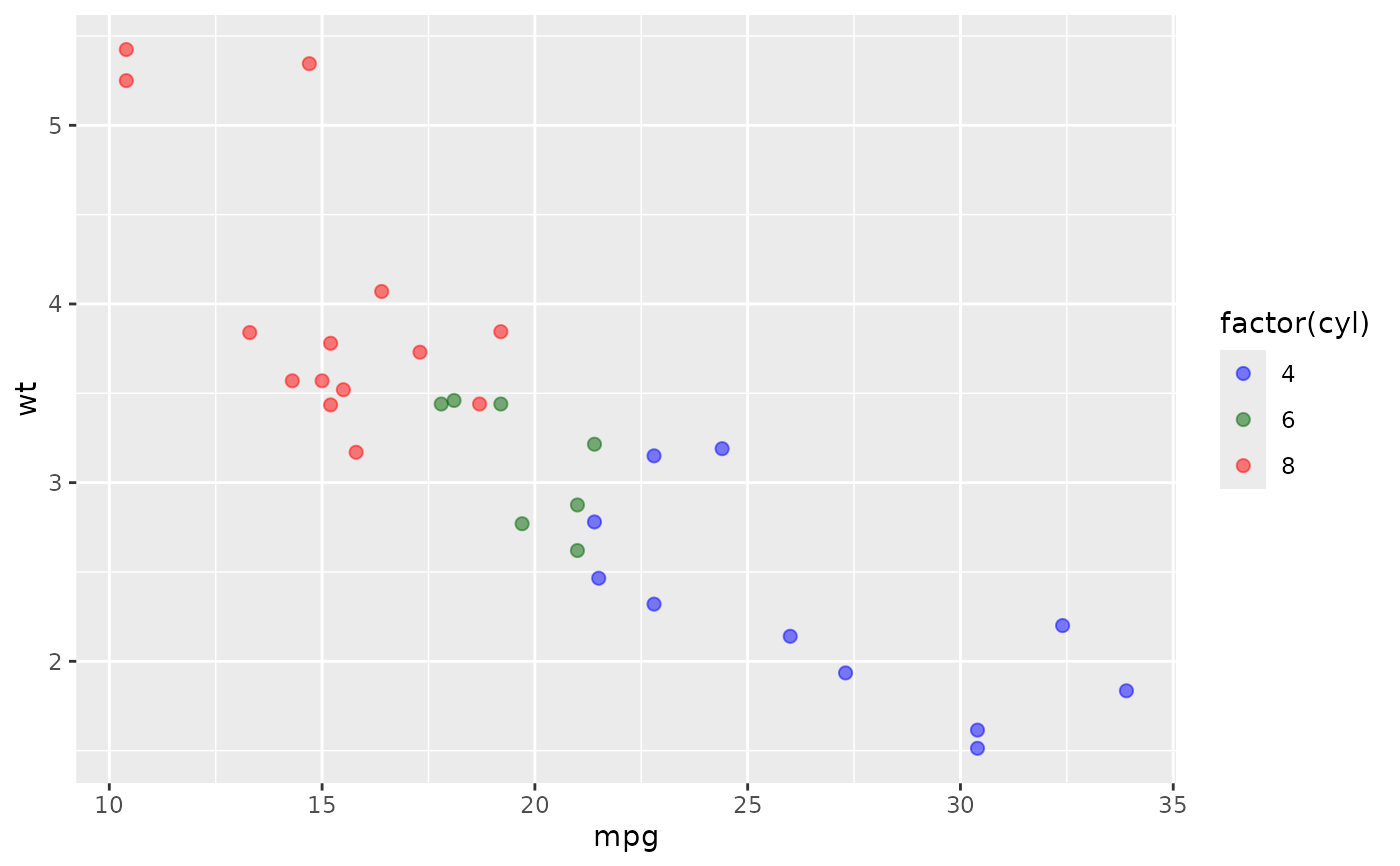
 # You can set color and fill aesthetics at the same time
ggplot(
mtcars,
aes(mpg, wt, colour = factor(cyl), fill = factor(cyl))
) +
geom_point(shape = 21, alpha = 0.5, size = 2) +
scale_colour_manual(
values = cols,
aesthetics = c("colour", "fill")
)
# You can set color and fill aesthetics at the same time
ggplot(
mtcars,
aes(mpg, wt, colour = factor(cyl), fill = factor(cyl))
) +
geom_point(shape = 21, alpha = 0.5, size = 2) +
scale_colour_manual(
values = cols,
aesthetics = c("colour", "fill")
)
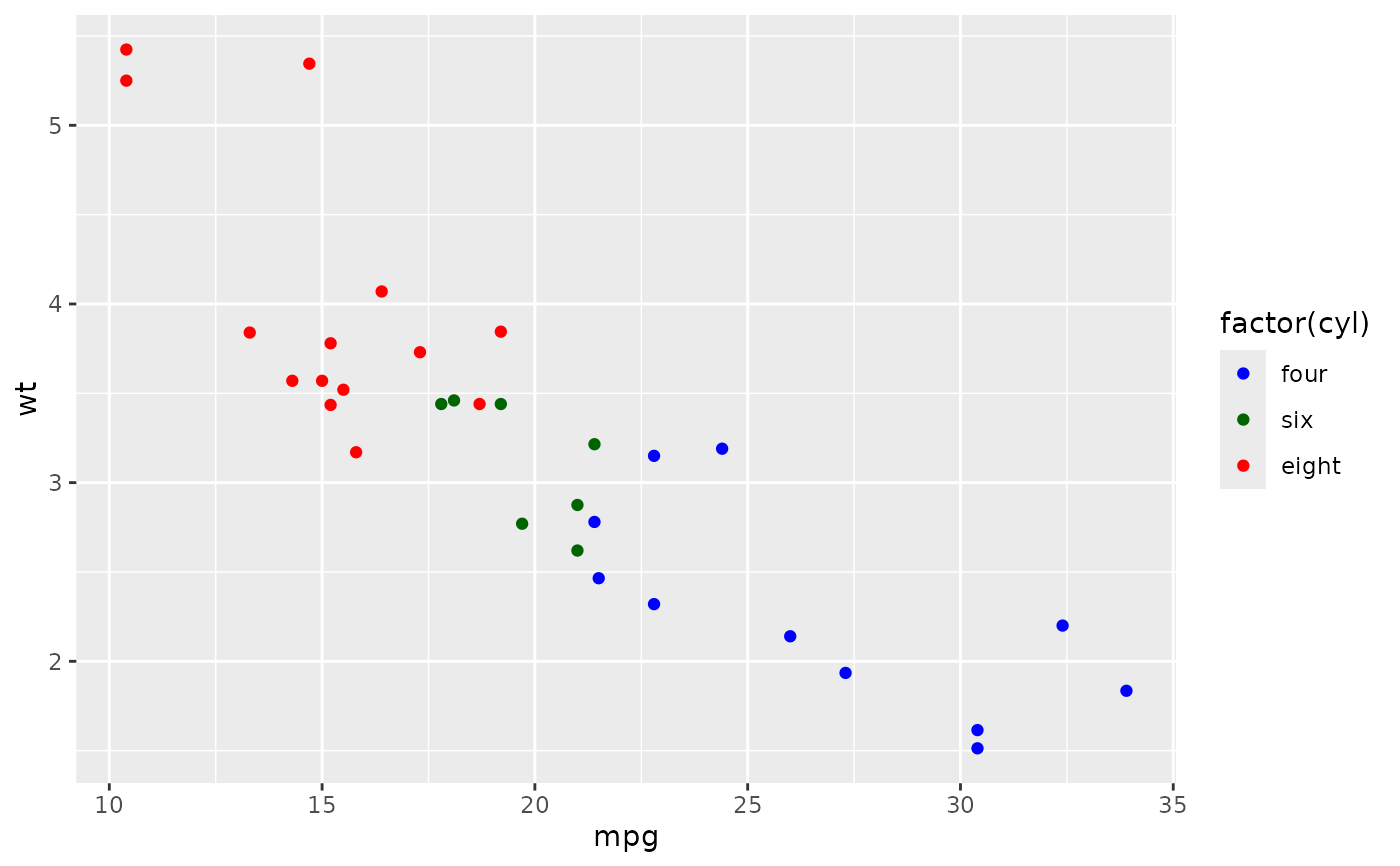
 # As with other scales you can use breaks to control the appearance
# of the legend.
p + scale_colour_manual(values = cols)
# As with other scales you can use breaks to control the appearance
# of the legend.
p + scale_colour_manual(values = cols)
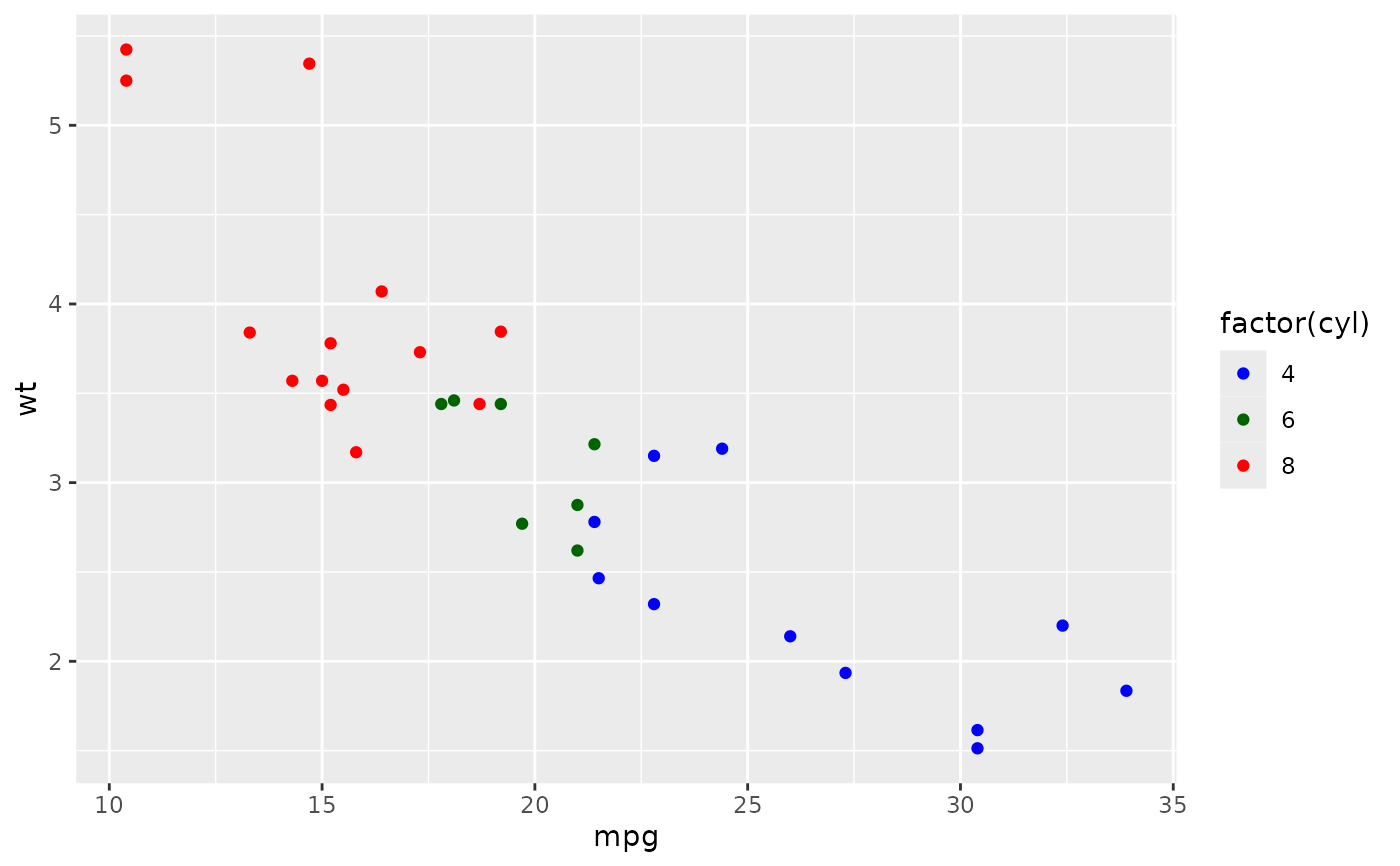
 p + scale_colour_manual(
values = cols,
breaks = c("4", "6", "8"),
labels = c("four", "six", "eight")
)
p + scale_colour_manual(
values = cols,
breaks = c("4", "6", "8"),
labels = c("four", "six", "eight")
)
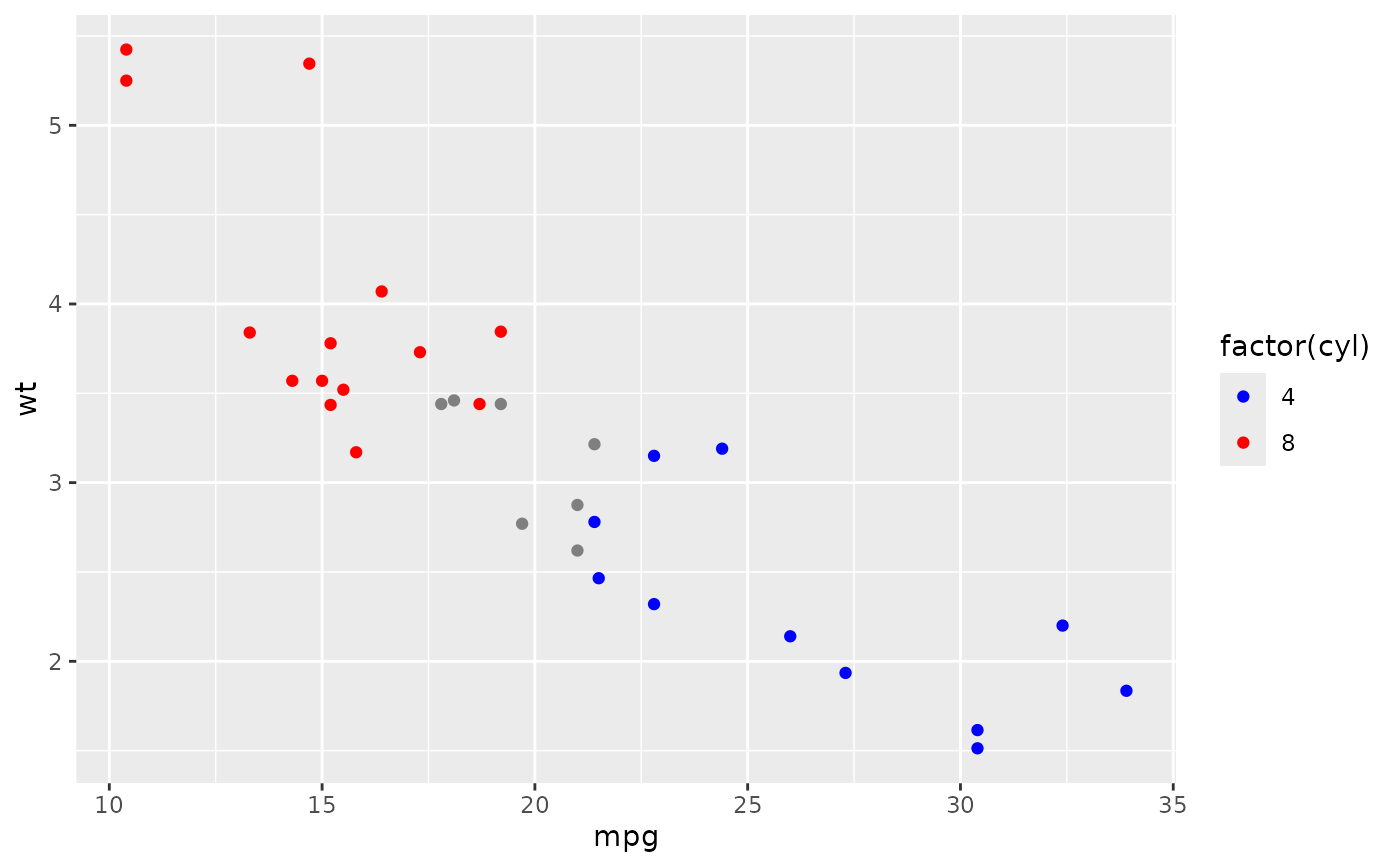
 # And limits to control the possible values of the scale
p + scale_colour_manual(values = cols, limits = c("4", "8"))
# And limits to control the possible values of the scale
p + scale_colour_manual(values = cols, limits = c("4", "8"))
 p + scale_colour_manual(values = cols, limits = c("4", "6", "8", "10"))