These are the default scales for the three date/time class. These will
usually be added automatically. To override manually, use
scale_*_date for dates (class Date),
scale_*_datetime for datetimes (class POSIXct), and
scale_*_time for times (class hms).
Usage
scale_x_date(
  name = waiver(),
  breaks = waiver(),
  date_breaks = waiver(),
  labels = waiver(),
  date_labels = waiver(),
  minor_breaks = waiver(),
  date_minor_breaks = waiver(),
  limits = NULL,
  expand = waiver(),
  oob = censor,
  guide = waiver(),
  position = "bottom",
  sec.axis = waiver()
)

scale_y_date(
  name = waiver(),
  breaks = waiver(),
  date_breaks = waiver(),
  labels = waiver(),
  date_labels = waiver(),
  minor_breaks = waiver(),
  date_minor_breaks = waiver(),
  limits = NULL,
  expand = waiver(),
  oob = censor,
  guide = waiver(),
  position = "left",
  sec.axis = waiver()
)

scale_x_datetime(
  name = waiver(),
  breaks = waiver(),
  date_breaks = waiver(),
  labels = waiver(),
  date_labels = waiver(),
  minor_breaks = waiver(),
  date_minor_breaks = waiver(),
  timezone = NULL,
  limits = NULL,
  expand = waiver(),
  oob = censor,
  guide = waiver(),
  position = "bottom",
  sec.axis = waiver()
)

scale_y_datetime(
  name = waiver(),
  breaks = waiver(),
  date_breaks = waiver(),
  labels = waiver(),
  date_labels = waiver(),
  minor_breaks = waiver(),
  date_minor_breaks = waiver(),
  timezone = NULL,
  limits = NULL,
  expand = waiver(),
  oob = censor,
  guide = waiver(),
  position = "left",
  sec.axis = waiver()
)

scale_x_time(
  name = waiver(),
  breaks = waiver(),
  date_breaks = waiver(),
  minor_breaks = waiver(),
  date_minor_breaks = waiver(),
  labels = waiver(),
  date_labels = waiver(),
  limits = NULL,
  expand = waiver(),
  oob = censor,
  na.value = NA_real_,
  guide = waiver(),
  position = "bottom",
  sec.axis = waiver()
)

scale_y_time(
  name = waiver(),
  breaks = waiver(),
  date_breaks = waiver(),
  minor_breaks = waiver(),
  date_minor_breaks = waiver(),
  labels = waiver(),
  date_labels = waiver(),
  limits = NULL,
  expand = waiver(),
  oob = censor,
  na.value = NA_real_,
  guide = waiver(),
  position = "left",
  sec.axis = waiver()
)
Arguments
- name
The name of the scale. Used as the axis or legend title. If
waiver(), the default, the name of the scale is taken from the first mapping used for that aesthetic. IfNULL, the legend title will be omitted.- breaks
One of:
NULLfor no breakswaiver()for the breaks specified bydate_breaksA
Date/POSIXctvector giving positions of breaksA function that takes the limits as input and returns breaks as output
- date_breaks
A string giving the distance between breaks like "2 weeks", or "10 years". If both
breaksanddate_breaksare specified,date_breakswins. Valid specifications are 'sec', 'min', 'hour', 'day', 'week', 'month' or 'year', optionally followed by 's'.- labels
One of the options below. Please note that when
labelsis a vector, it is highly recommended to also set thebreaksargument as a vector to protect against unintended mismatches.NULLfor no labelswaiver()for the default labels computed by the transformation objectA character vector giving labels (must be same length as
breaks)An expression vector (must be the same length as breaks). See ?plotmath for details.
A function that takes the breaks as input and returns labels as output. Also accepts rlang lambda function notation.
- date_labels
A string giving the formatting specification for the labels. Codes are defined in
strftime(). If bothlabelsanddate_labelsare specified,date_labelswins.- minor_breaks
One of:
NULLfor no breakswaiver()for the breaks specified bydate_minor_breaksA
Date/POSIXctvector giving positions of minor breaksA function that takes the limits as input and returns minor breaks as output
- date_minor_breaks
A string giving the distance between minor breaks like "2 weeks", or "10 years". If both
minor_breaksanddate_minor_breaksare specified,date_minor_breakswins. Valid specifications are 'sec', 'min', 'hour', 'day', 'week', 'month' or 'year', optionally followed by 's'.- limits
One of:
NULLto use the default scale rangeA numeric vector of length two providing limits of the scale. Use
NAto refer to the existing minimum or maximumA function that accepts the existing (automatic) limits and returns new limits. Also accepts rlang lambda function notation. Note that setting limits on positional scales will remove data outside of the limits. If the purpose is to zoom, use the limit argument in the coordinate system (see
coord_cartesian()).
- expand
For position scales, a vector of range expansion constants used to add some padding around the data to ensure that they are placed some distance away from the axes. Use the convenience function
expansion()to generate the values for theexpandargument. The defaults are to expand the scale by 5% on each side for continuous variables, and by 0.6 units on each side for discrete variables.- oob
One of:
Function that handles limits outside of the scale limits (out of bounds). Also accepts rlang lambda function notation.
The default (
scales::censor()) replaces out of bounds values withNA.scales::squish()for squishing out of bounds values into range.scales::squish_infinite()for squishing infinite values into range.
- guide
A function used to create a guide or its name. See
guides()for more information.- position
For position scales, The position of the axis.
leftorrightfor y axes,toporbottomfor x axes.- sec.axis
sec_axis()is used to specify a secondary axis.- timezone
The timezone to use for display on the axes. The default (
NULL) uses the timezone encoded in the data.- na.value
Missing values will be replaced with this value.
See also
sec_axis() for how to specify secondary axes.
The date-time position scales section of the online ggplot2 book.
Other position scales:
scale_x_binned(),
scale_x_continuous(),
scale_x_discrete()
Examples
last_month <- Sys.Date() - 0:29
set.seed(1)
df <- data.frame(
date = last_month,
price = runif(30)
)
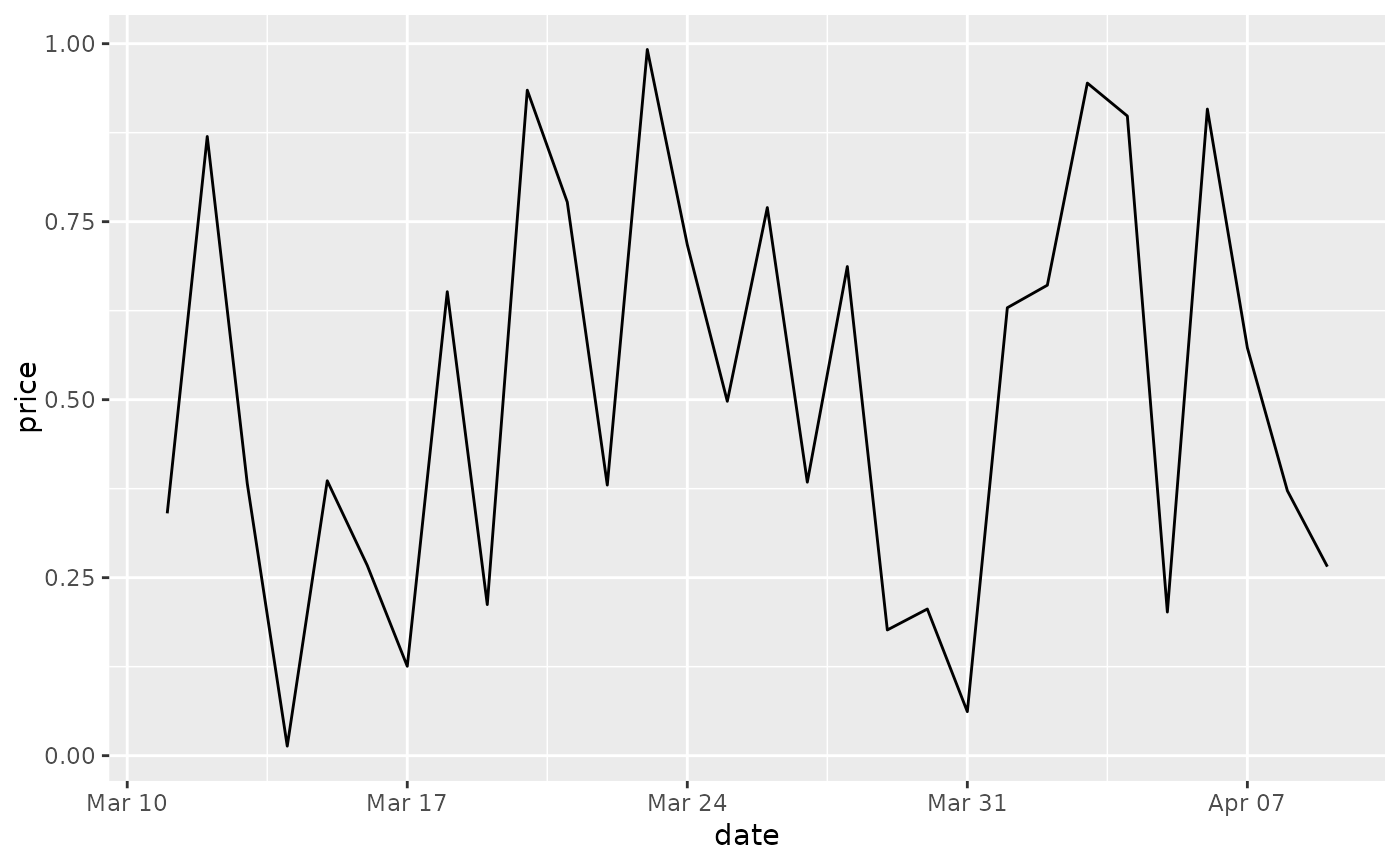
base <- ggplot(df, aes(date, price)) +
geom_line()
# The date scale will attempt to pick sensible defaults for
# major and minor tick marks. Override with date_breaks, date_labels
# date_minor_breaks arguments.
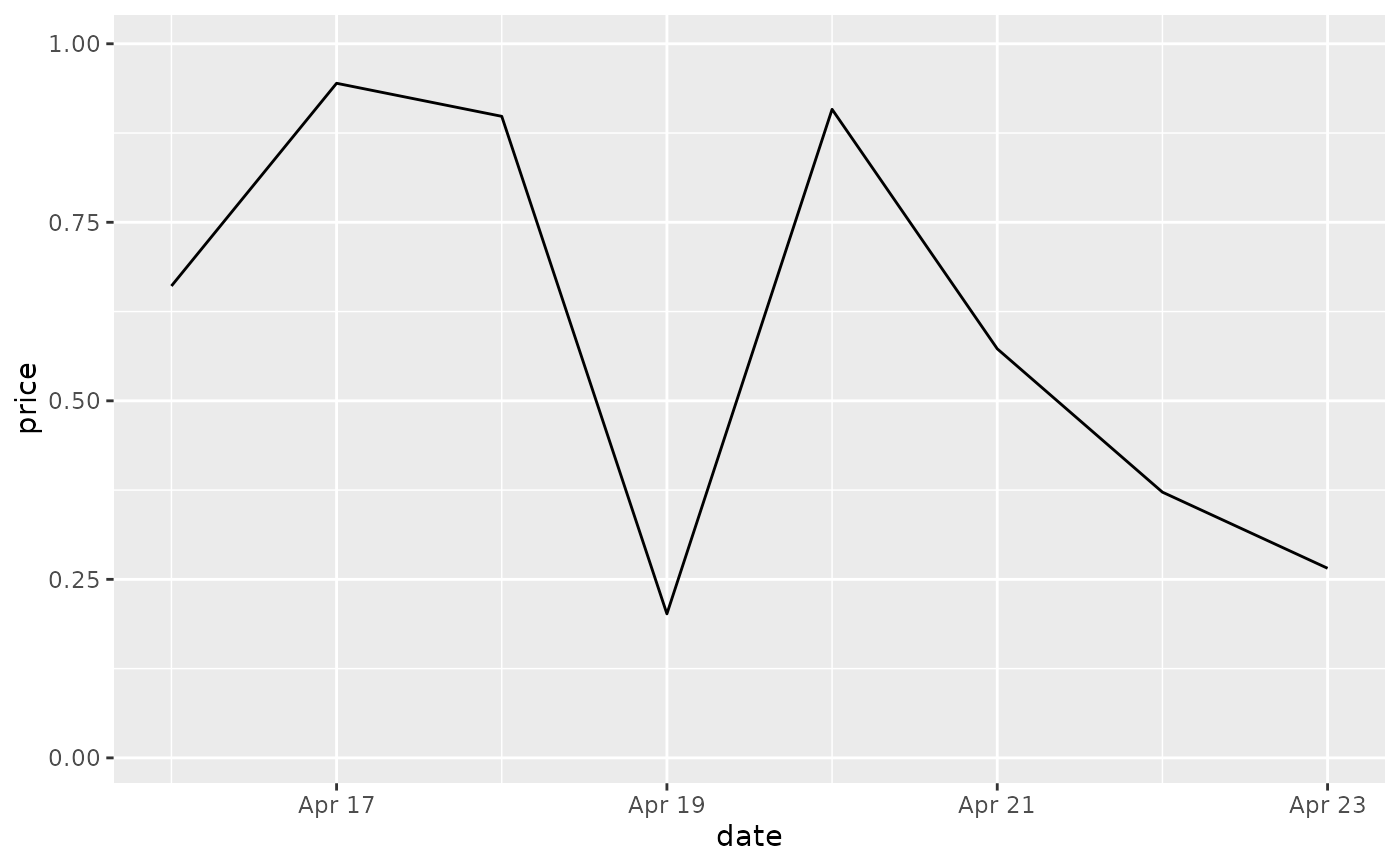
base + scale_x_date(date_labels = "%b %d")
 base + scale_x_date(date_breaks = "1 week", date_labels = "%W")
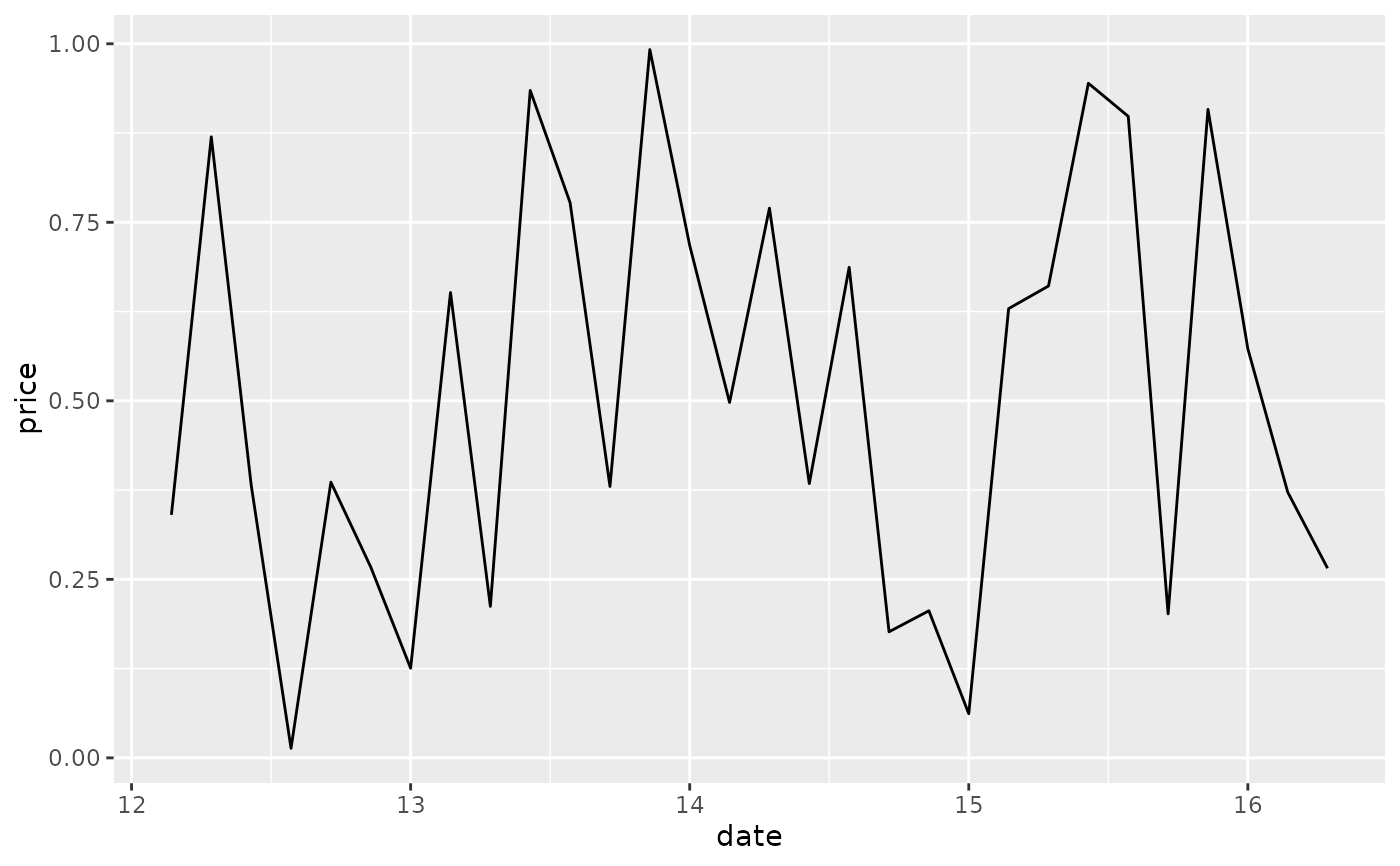 base + scale_x_date(date_minor_breaks = "1 day")
 # Set limits
base + scale_x_date(limits = c(Sys.Date() - 7, NA))
#> Warning: Removed 22 rows containing missing values or values outside the scale
#> range (`geom_line()`).
# Set limits
base + scale_x_date(limits = c(Sys.Date() - 7, NA))
#> Warning: Removed 22 rows containing missing values or values outside the scale
#> range (`geom_line()`).