scale_x_continuous() and scale_y_continuous() are the default
scales for continuous x and y aesthetics. There are three variants
that set the transform argument for commonly used transformations:
scale_*_log10(), scale_*_sqrt() and scale_*_reverse().
Usage
scale_x_continuous(
  name = waiver(),
  breaks = waiver(),
  minor_breaks = waiver(),
  n.breaks = NULL,
  labels = waiver(),
  limits = NULL,
  expand = waiver(),
  oob = censor,
  na.value = NA_real_,
  transform = "identity",
  trans = deprecated(),
  guide = waiver(),
  position = "bottom",
  sec.axis = waiver()
)

scale_y_continuous(
  name = waiver(),
  breaks = waiver(),
  minor_breaks = waiver(),
  n.breaks = NULL,
  labels = waiver(),
  limits = NULL,
  expand = waiver(),
  oob = censor,
  na.value = NA_real_,
  transform = "identity",
  trans = deprecated(),
  guide = waiver(),
  position = "left",
  sec.axis = waiver()
)

scale_x_log10(...)

scale_y_log10(...)

scale_x_reverse(...)

scale_y_reverse(...)

scale_x_sqrt(...)

scale_y_sqrt(...)
Arguments
- name
The name of the scale. Used as the axis or legend title. If
waiver(), the default, the name of the scale is taken from the first mapping used for that aesthetic. IfNULL, the legend title will be omitted.- breaks
One of:
NULLfor no breakswaiver()for the default breaks computed by the transformation objectA numeric vector of positions
A function that takes the limits as input and returns breaks as output (e.g., a function returned by
scales::extended_breaks()). Note that for position scales, limits are provided after scale expansion. Also accepts rlang lambda function notation.
- minor_breaks
One of:
NULLfor no minor breakswaiver()for the default breaks (none for discrete, one minor break between each major break for continuous)A numeric vector of positions
A function that given the limits returns a vector of minor breaks. Also accepts rlang lambda function notation. When the function has two arguments, it will be given the limits and major break positions.
- n.breaks
An integer guiding the number of major breaks. The algorithm may choose a slightly different number to ensure nice break labels. Will only have an effect if
breaks = waiver(). UseNULLto use the default number of breaks given by the transformation.- labels
One of the options below. Please note that when
labelsis a vector, it is highly recommended to also set thebreaksargument as a vector to protect against unintended mismatches.NULLfor no labelswaiver()for the default labels computed by the transformation objectA character vector giving labels (must be same length as
breaks)An expression vector (must be the same length as breaks). See ?plotmath for details.
A function that takes the breaks as input and returns labels as output. Also accepts rlang lambda function notation.
- limits
One of:
NULLto use the default scale rangeA numeric vector of length two providing limits of the scale. Use
NAto refer to the existing minimum or maximumA function that accepts the existing (automatic) limits and returns new limits. Also accepts rlang lambda function notation. Note that setting limits on positional scales will remove data outside of the limits. If the purpose is to zoom, use the limit argument in the coordinate system (see
coord_cartesian()).
- expand
For position scales, a vector of range expansion constants used to add some padding around the data to ensure that they are placed some distance away from the axes. Use the convenience function
expansion()to generate the values for theexpandargument. The defaults are to expand the scale by 5% on each side for continuous variables, and by 0.6 units on each side for discrete variables.- oob
One of:
Function that handles limits outside of the scale limits (out of bounds). Also accepts rlang lambda function notation.
The default (
scales::censor()) replaces out of bounds values withNA.scales::squish()for squishing out of bounds values into range.scales::squish_infinite()for squishing infinite values into range.
- na.value
Missing values will be replaced with this value.
- transform
For continuous scales, the name of a transformation object or the object itself. Built-in transformations include "asn", "atanh", "boxcox", "date", "exp", "hms", "identity", "log", "log10", "log1p", "log2", "logit", "modulus", "probability", "probit", "pseudo_log", "reciprocal", "reverse", "sqrt" and "time".
A transformation object bundles together a transform, its inverse, and methods for generating breaks and labels. Transformation objects are defined in the scales package, and are called
transform_<name>. If transformations require arguments, you can call them from the scales package, e.g.scales::transform_boxcox(p = 2). You can create your own transformation withscales::new_transform().- trans
![[Deprecated]](figures/lifecycle-deprecated.svg) Deprecated in favour of
Deprecated in favour of
transform.- guide
A function used to create a guide or its name. See
guides()for more information.- position
For position scales, The position of the axis.
leftorrightfor y axes,toporbottomfor x axes.- sec.axis
sec_axis()is used to specify a secondary axis.- ...
Other arguments passed on to
scale_(x|y)_continuous()
Details
For simple manipulation of labels and limits, you may wish to use
labs() and lims() instead.
See also
The numeric position scales section of the online ggplot2 book.
Other position scales:
scale_x_binned(),
scale_x_date(),
scale_x_discrete()
Examples
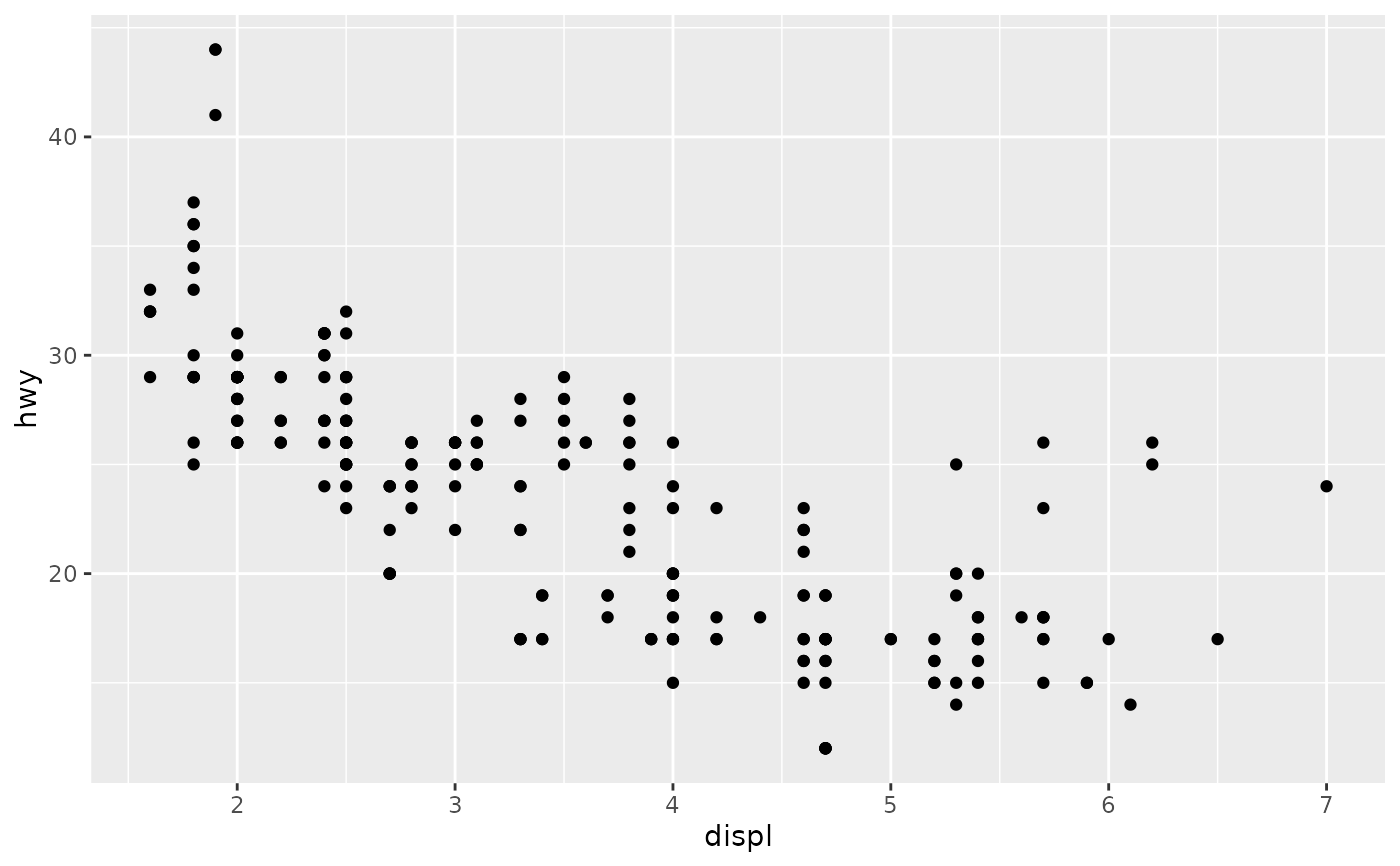
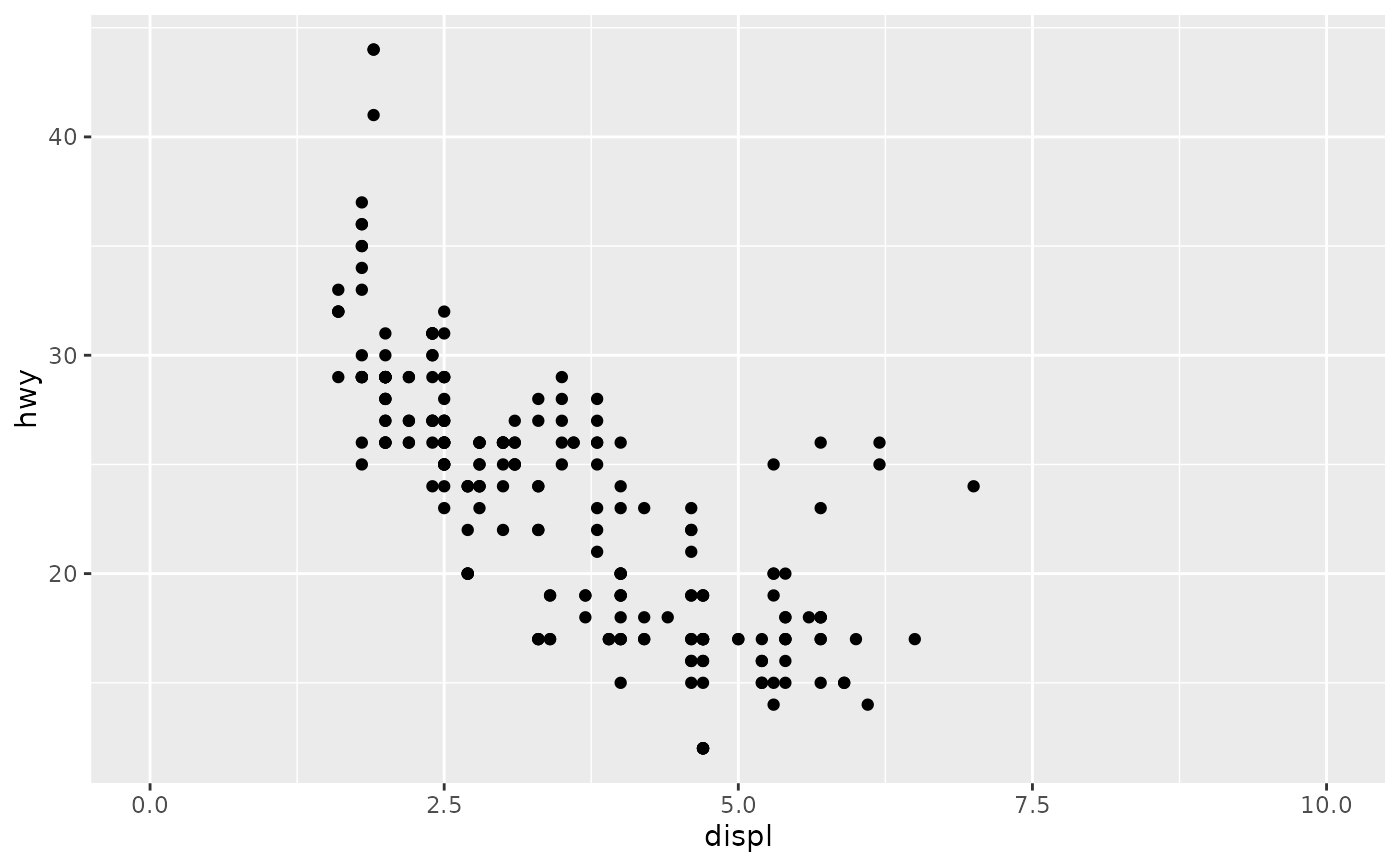
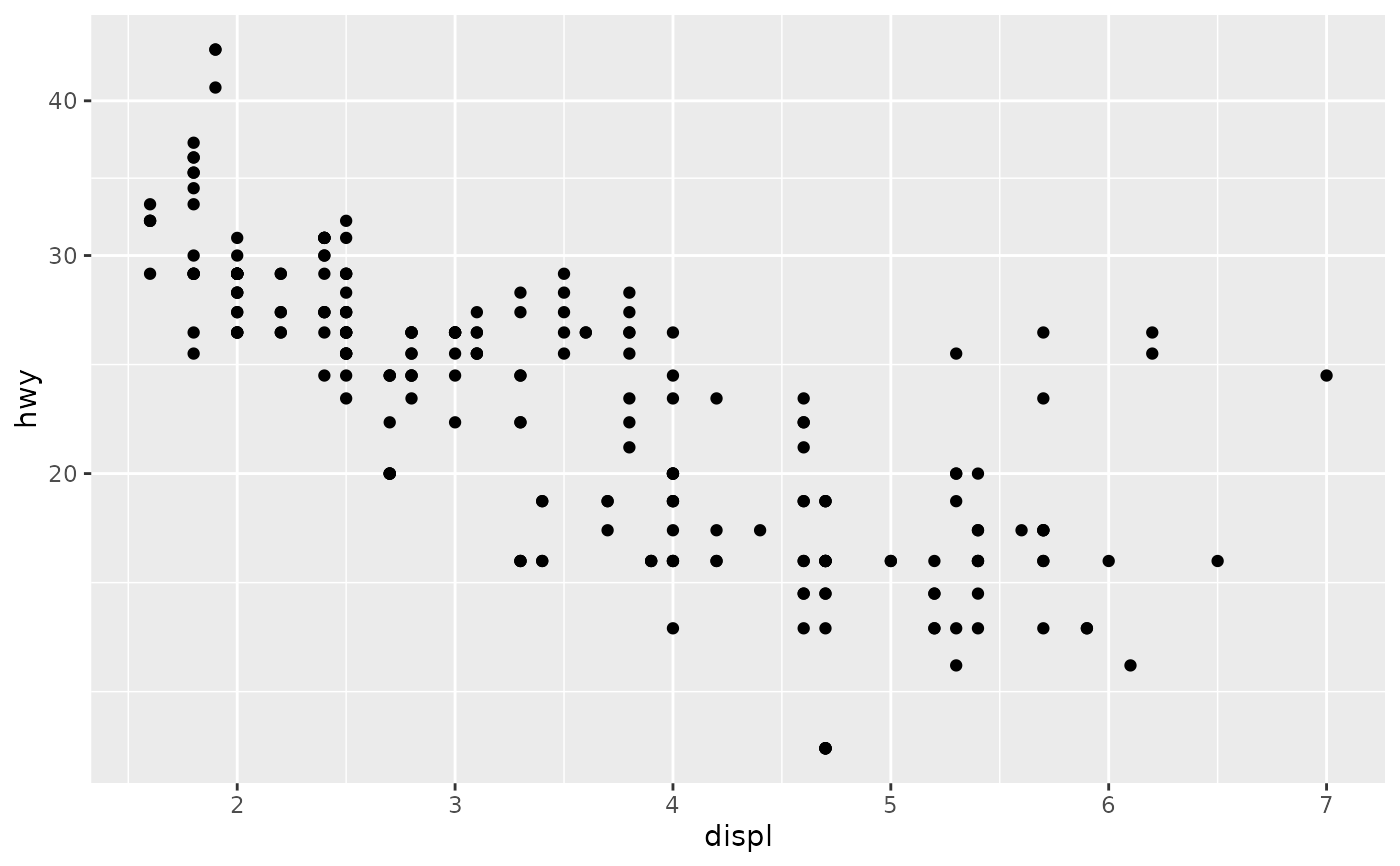
p1 <- ggplot(mpg, aes(displ, hwy)) +
geom_point()
p1
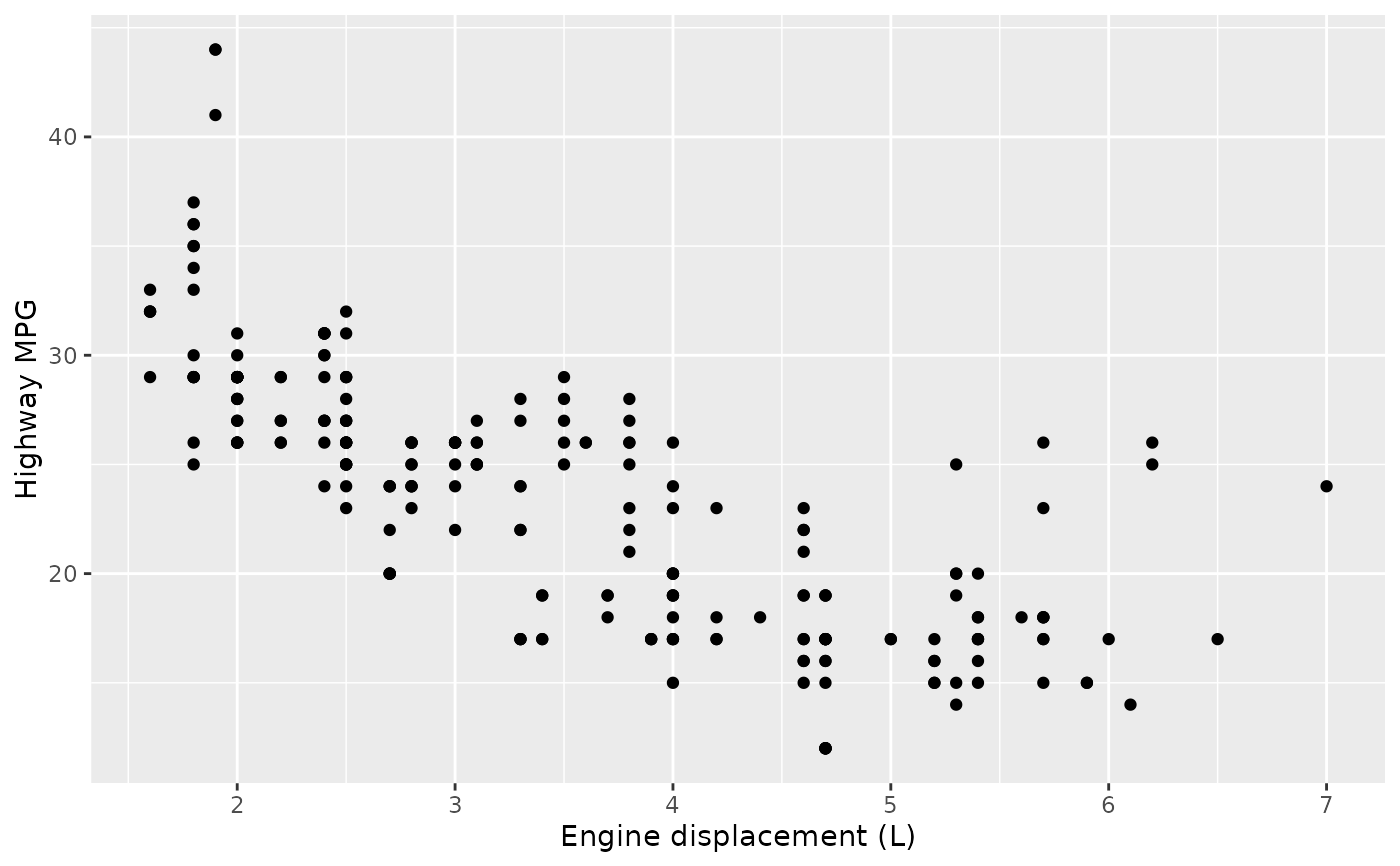
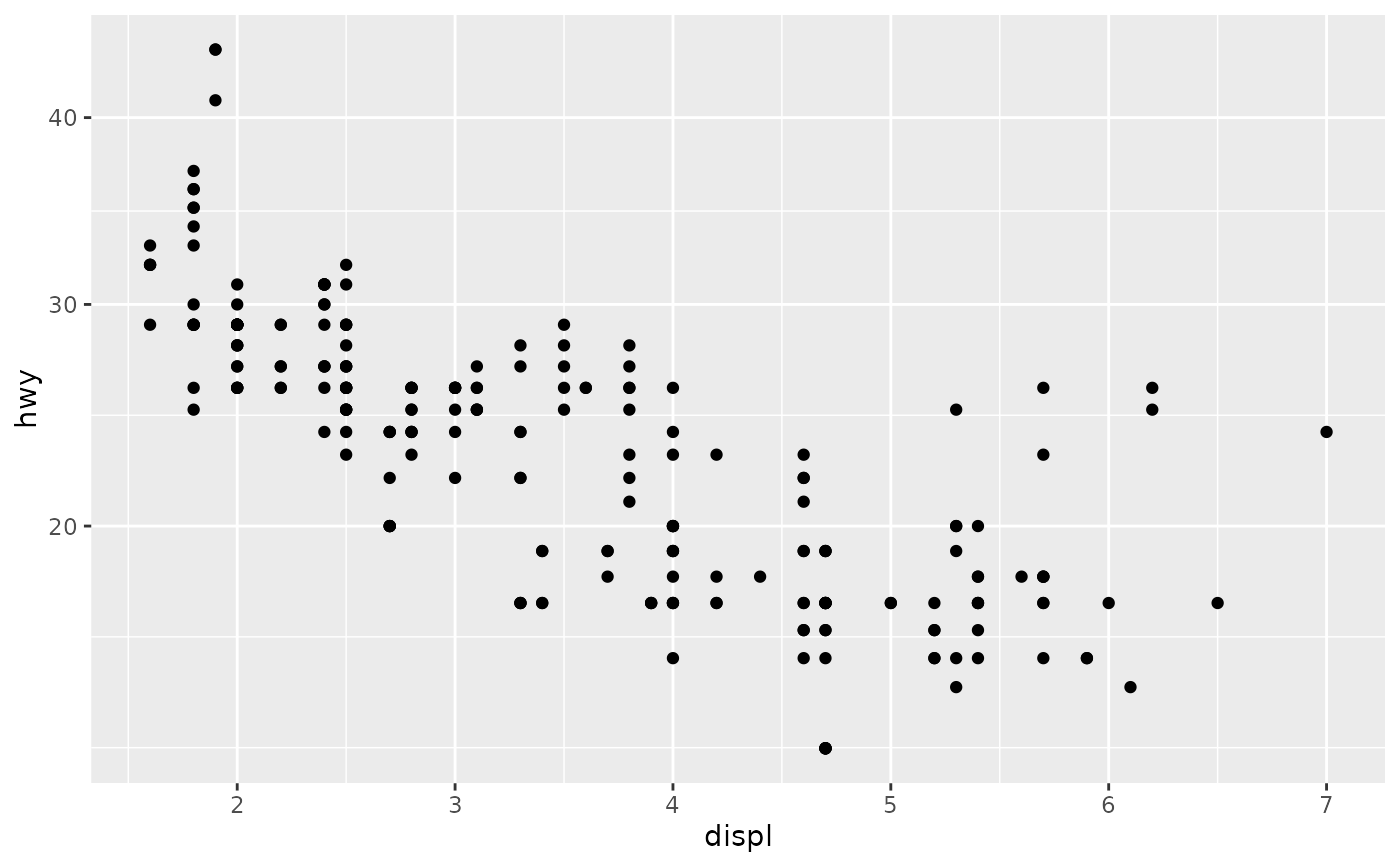
 # Manipulating the default position scales lets you:
# * change the axis labels
p1 +
scale_x_continuous("Engine displacement (L)") +
scale_y_continuous("Highway MPG")
# Manipulating the default position scales lets you:
# * change the axis labels
p1 +
scale_x_continuous("Engine displacement (L)") +
scale_y_continuous("Highway MPG")
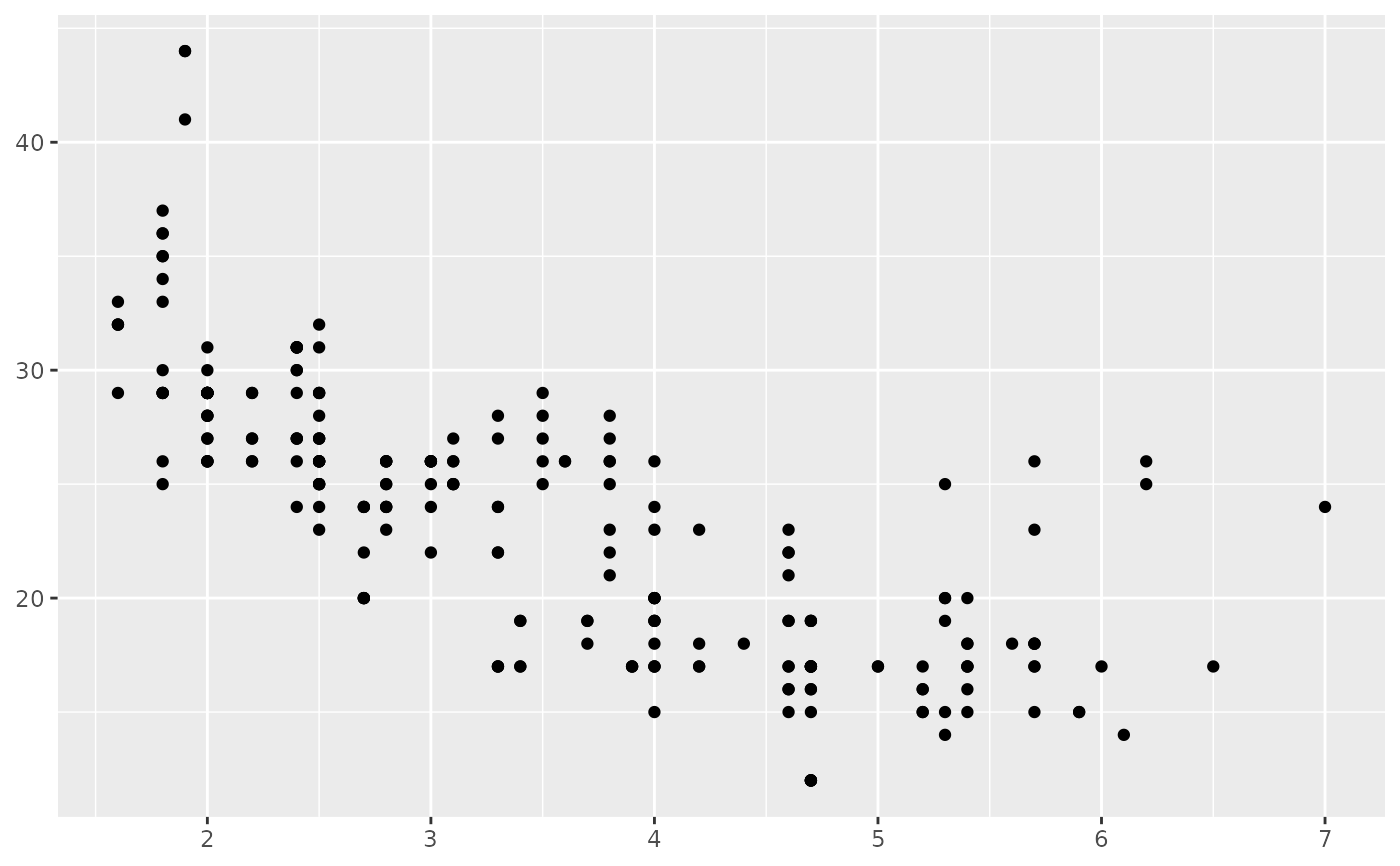
 # You can also use the short-cut labs().
# Use NULL to suppress axis labels
p1 + labs(x = NULL, y = NULL)
# You can also use the short-cut labs().
# Use NULL to suppress axis labels
p1 + labs(x = NULL, y = NULL)
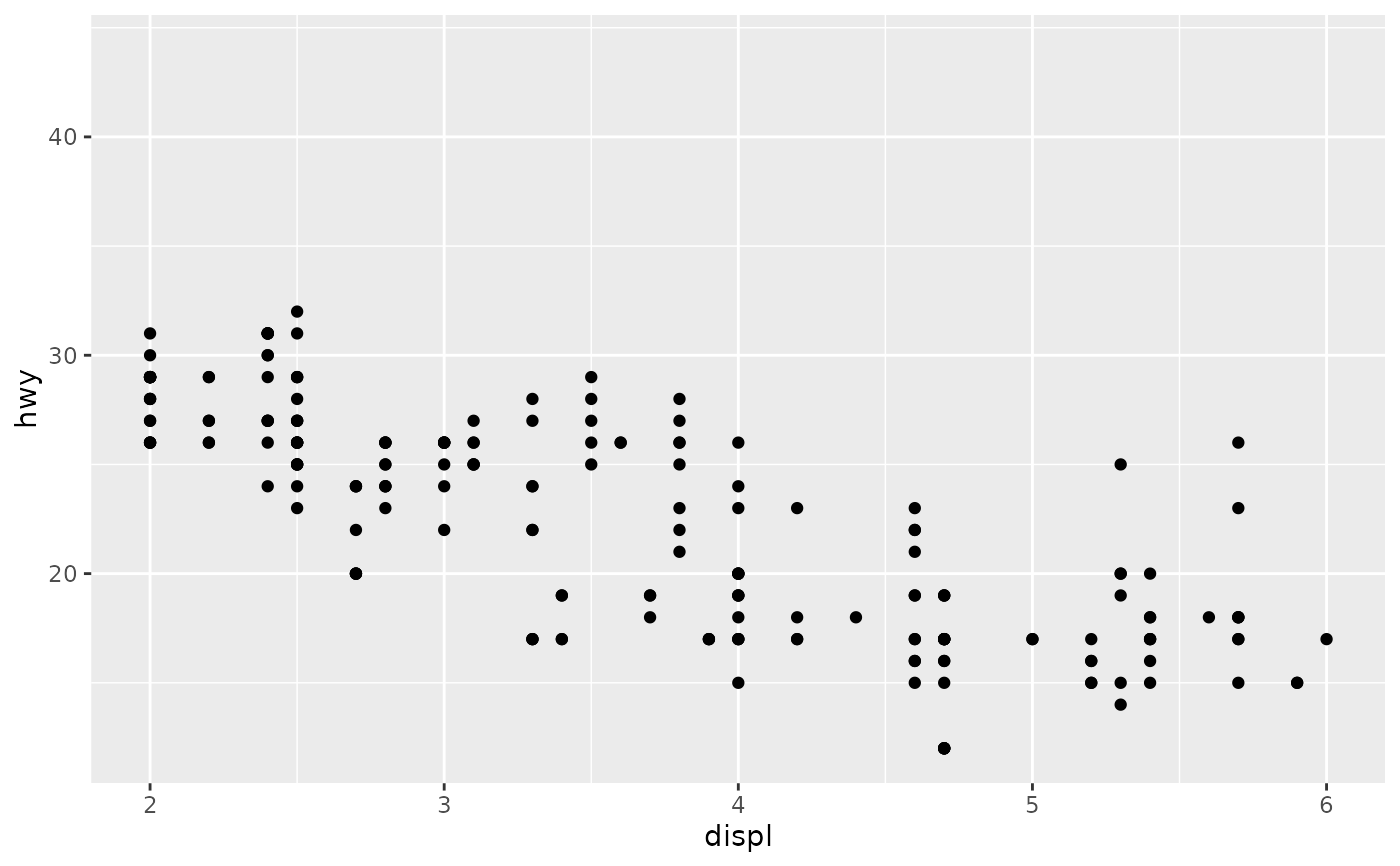
 # * modify the axis limits
p1 + scale_x_continuous(limits = c(2, 6))
#> Warning: Removed 27 rows containing missing values or values outside the scale
#> range (`geom_point()`).
# * modify the axis limits
p1 + scale_x_continuous(limits = c(2, 6))
#> Warning: Removed 27 rows containing missing values or values outside the scale
#> range (`geom_point()`).
 p1 + scale_x_continuous(limits = c(0, 10))
 # you can also use the short hand functions `xlim()` and `ylim()`
p1 + xlim(2, 6)
#> Warning: Removed 27 rows containing missing values or values outside the scale
#> range (`geom_point()`).
# you can also use the short hand functions `xlim()` and `ylim()`
p1 + xlim(2, 6)
#> Warning: Removed 27 rows containing missing values or values outside the scale
#> range (`geom_point()`).
 # * choose where the ticks appear
p1 + scale_x_continuous(breaks = c(2, 4, 6))
# * choose where the ticks appear
p1 + scale_x_continuous(breaks = c(2, 4, 6))
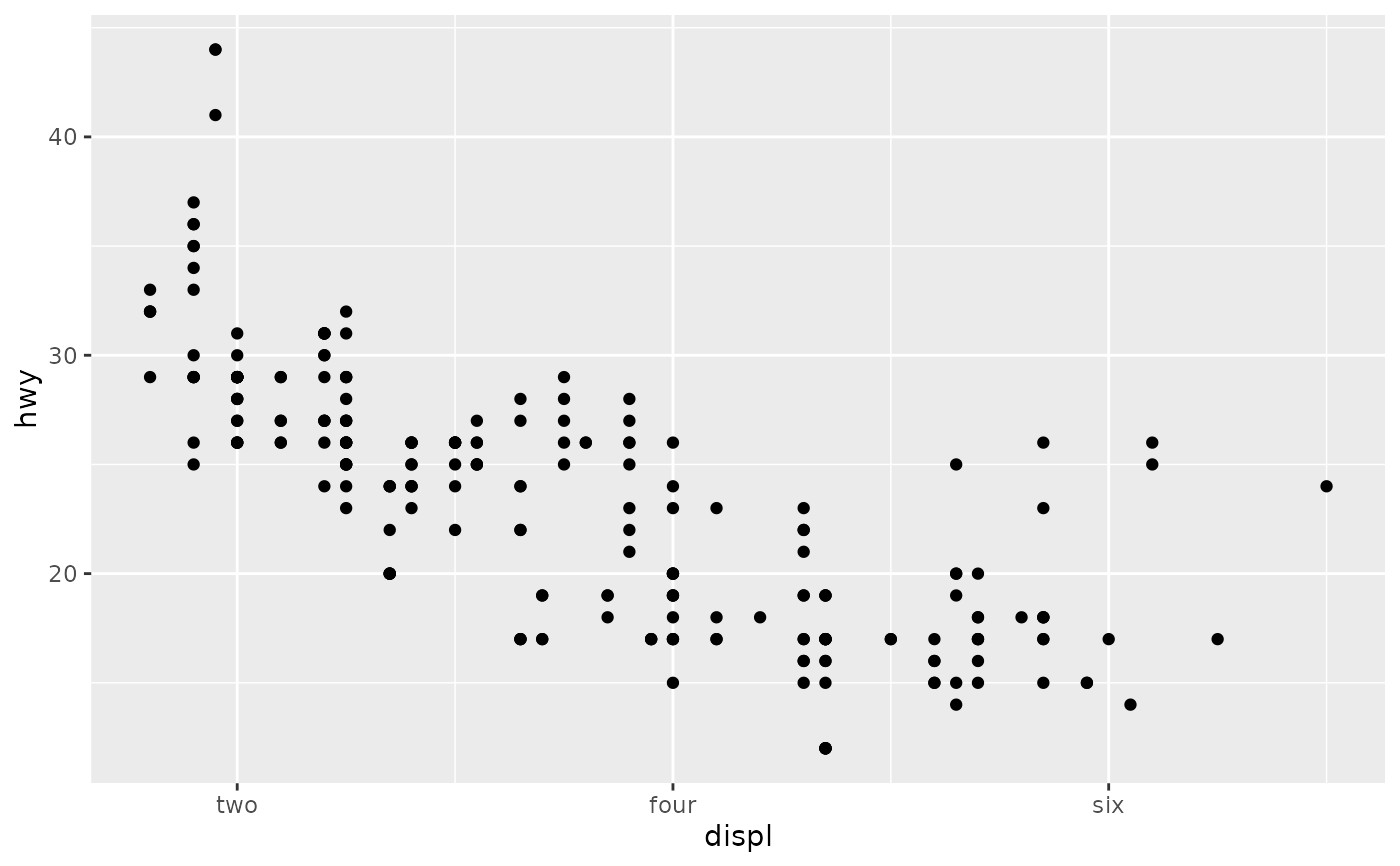
 # * choose your own labels
p1 + scale_x_continuous(
breaks = c(2, 4, 6),
label = c("two", "four", "six")
)
# * choose your own labels
p1 + scale_x_continuous(
breaks = c(2, 4, 6),
label = c("two", "four", "six")
)
 # Typically you'll pass a function to the `labels` argument.
# Some common formats are built into the scales package:
set.seed(1)
df <- data.frame(
x = rnorm(10) * 100000,
y = seq(0, 1, length.out = 10)
)
p2 <- ggplot(df, aes(x, y)) + geom_point()
p2 + scale_y_continuous(labels = scales::label_percent())
# Typically you'll pass a function to the `labels` argument.
# Some common formats are built into the scales package:
set.seed(1)
df <- data.frame(
x = rnorm(10) * 100000,
y = seq(0, 1, length.out = 10)
)
p2 <- ggplot(df, aes(x, y)) + geom_point()
p2 + scale_y_continuous(labels = scales::label_percent())
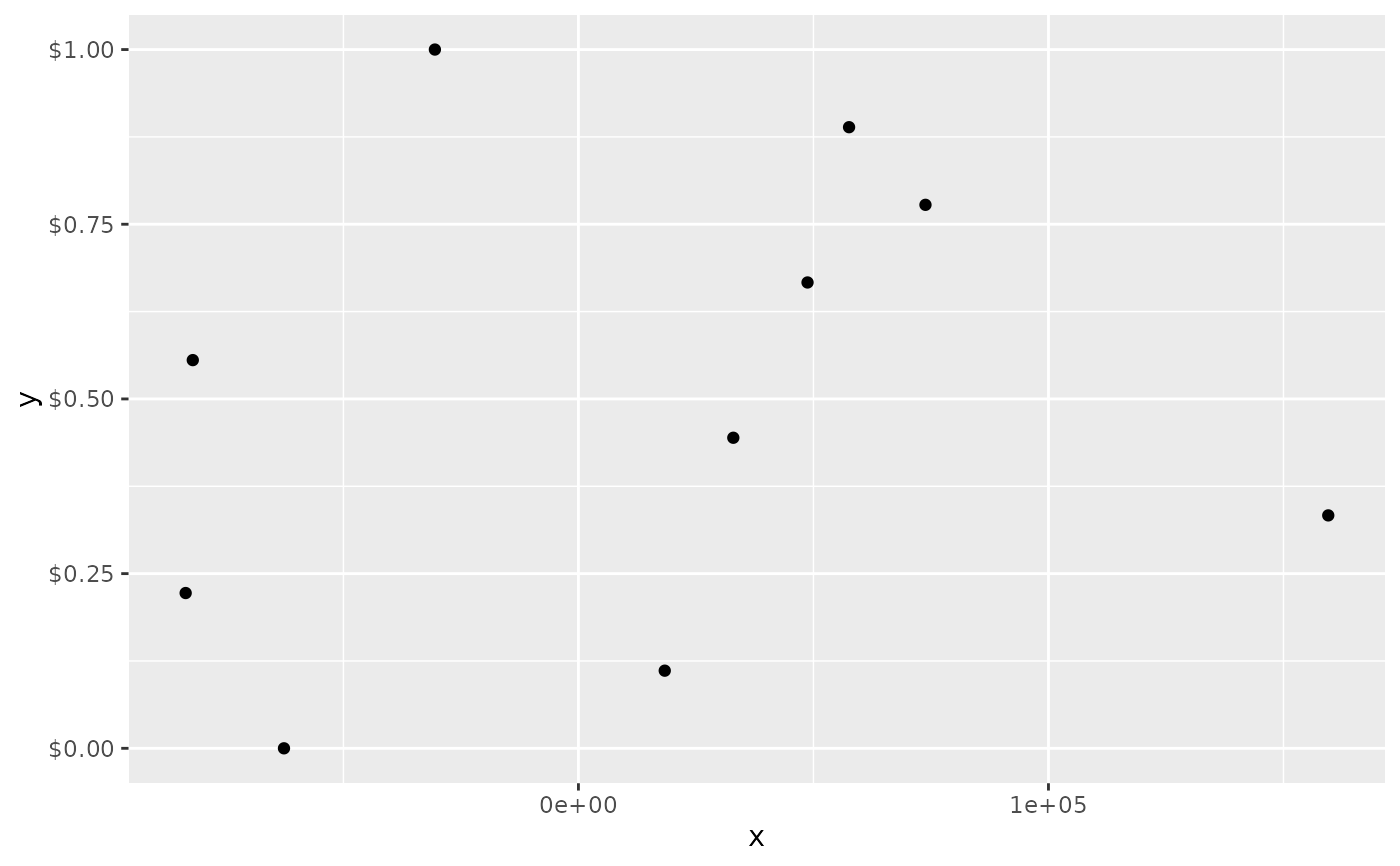
 p2 + scale_y_continuous(labels = scales::label_dollar())
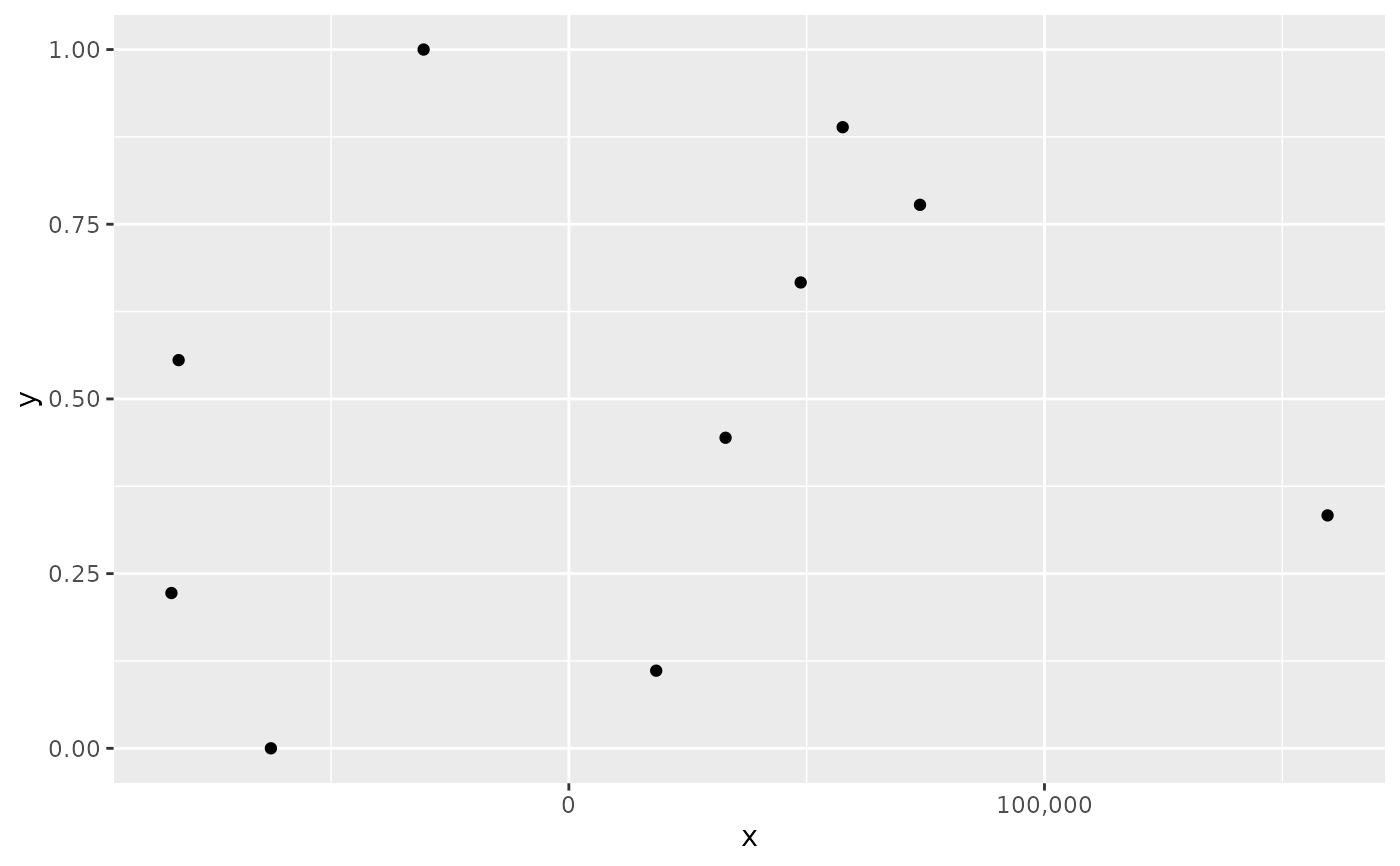
 p2 + scale_x_continuous(labels = scales::label_comma())
 # You can also override the default linear mapping by using a
# transformation. There are three shortcuts:
p1 + scale_y_log10()
# You can also override the default linear mapping by using a
# transformation. There are three shortcuts:
p1 + scale_y_log10()
 p1 + scale_y_sqrt()
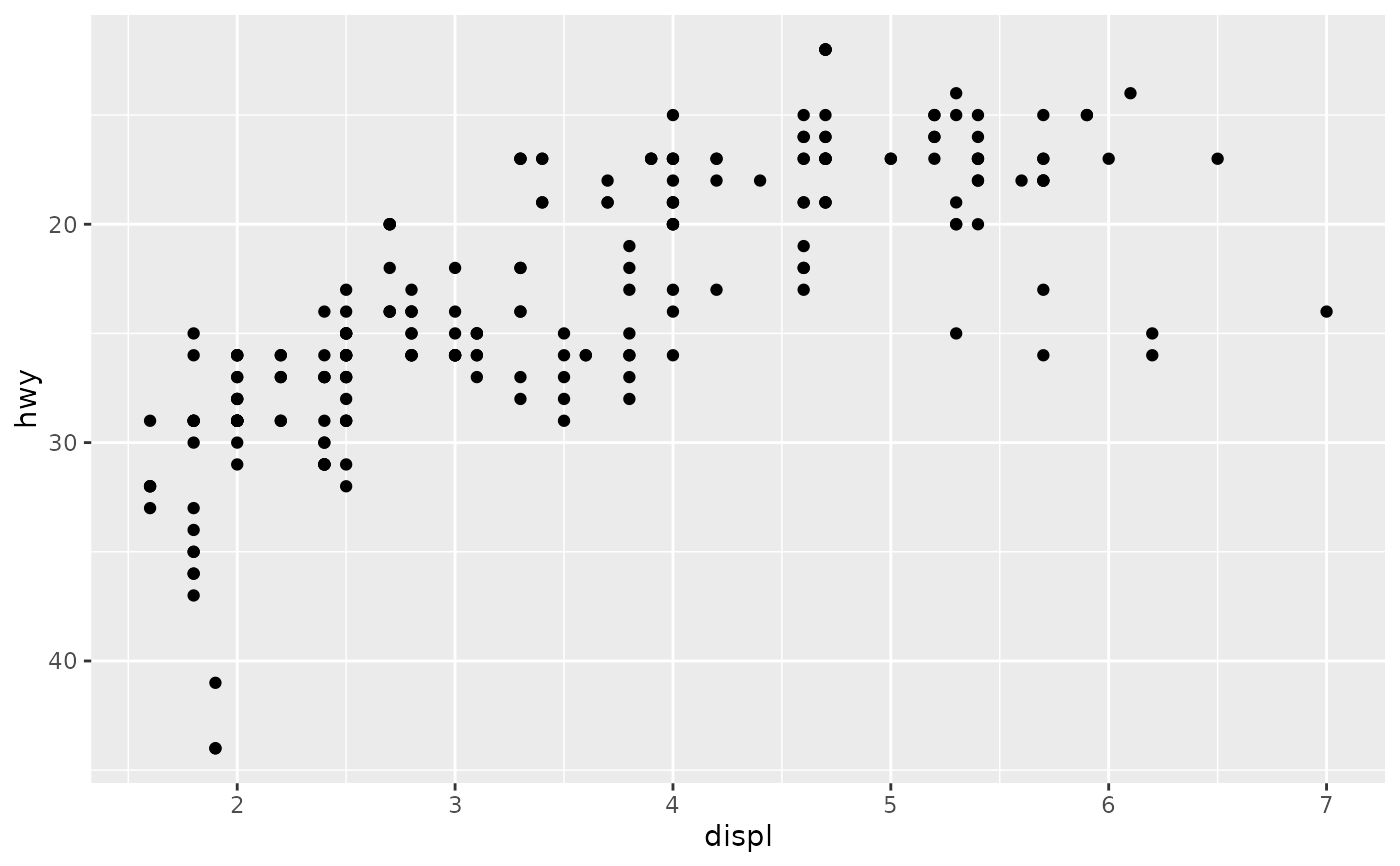
 p1 + scale_y_reverse()
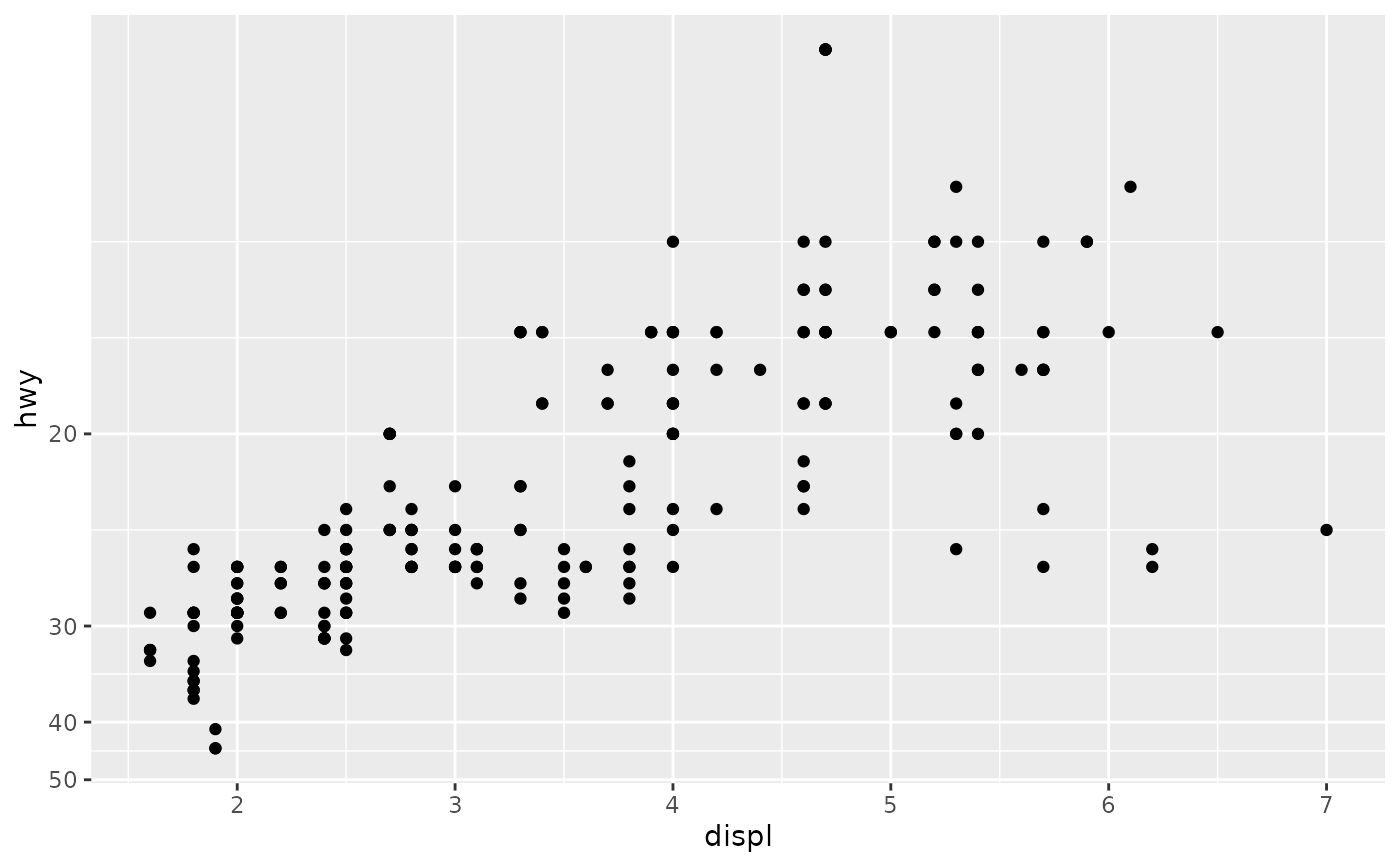
 # Or you can supply a transformation in the `trans` argument:
p1 + scale_y_continuous(transform = scales::transform_reciprocal())
# Or you can supply a transformation in the `trans` argument:
p1 + scale_y_continuous(transform = scales::transform_reciprocal())
 # You can also create your own. See ?scales::new_transform