Supplement the data fitted to a linear model with model fit statistics.
Source:R/fortify-models.R
fortify.lm.Rd![[Deprecated]](figures/lifecycle-deprecated.svg)
This method is deprecated because using broom::augment() is a better
solution to supplement data from a linear model.
If you have missing values in your model data, you may need to refit
the model with na.action = na.exclude.
Usage
# S3 method for class 'lm'
fortify(model, data = model$model, ...)Value
The original data with extra columns:
- .hat
Diagonal of the hat matrix
- .sigma
Estimate of residual standard deviation when corresponding observation is dropped from model
- .cooksd
Cooks distance,
cooks.distance()- .fitted
Fitted values of model
- .resid
Residuals
- .stdresid
Standardised residuals
Examples
mod <- lm(mpg ~ wt, data = mtcars)
# Show augmented model
head(augment(mod))
#> # A tibble: 6 × 9
#> .rownames mpg wt .fitted .resid .hat .sigma .cooksd .std.resid
#> <chr> <dbl> <dbl> <dbl> <dbl> <dbl> <dbl> <dbl> <dbl>
#> 1 Mazda RX4 21 2.62 23.3 -2.28 0.0433 3.07 1.33e-2 -0.766
#> 2 Mazda RX… 21 2.88 21.9 -0.920 0.0352 3.09 1.72e-3 -0.307
#> 3 Datsun 7… 22.8 2.32 24.9 -2.09 0.0584 3.07 1.54e-2 -0.706
#> 4 Hornet 4… 21.4 3.22 20.1 1.30 0.0313 3.09 3.02e-3 0.433
#> 5 Hornet S… 18.7 3.44 18.9 -0.200 0.0329 3.10 7.60e-5 -0.0668
#> 6 Valiant 18.1 3.46 18.8 -0.693 0.0332 3.10 9.21e-4 -0.231
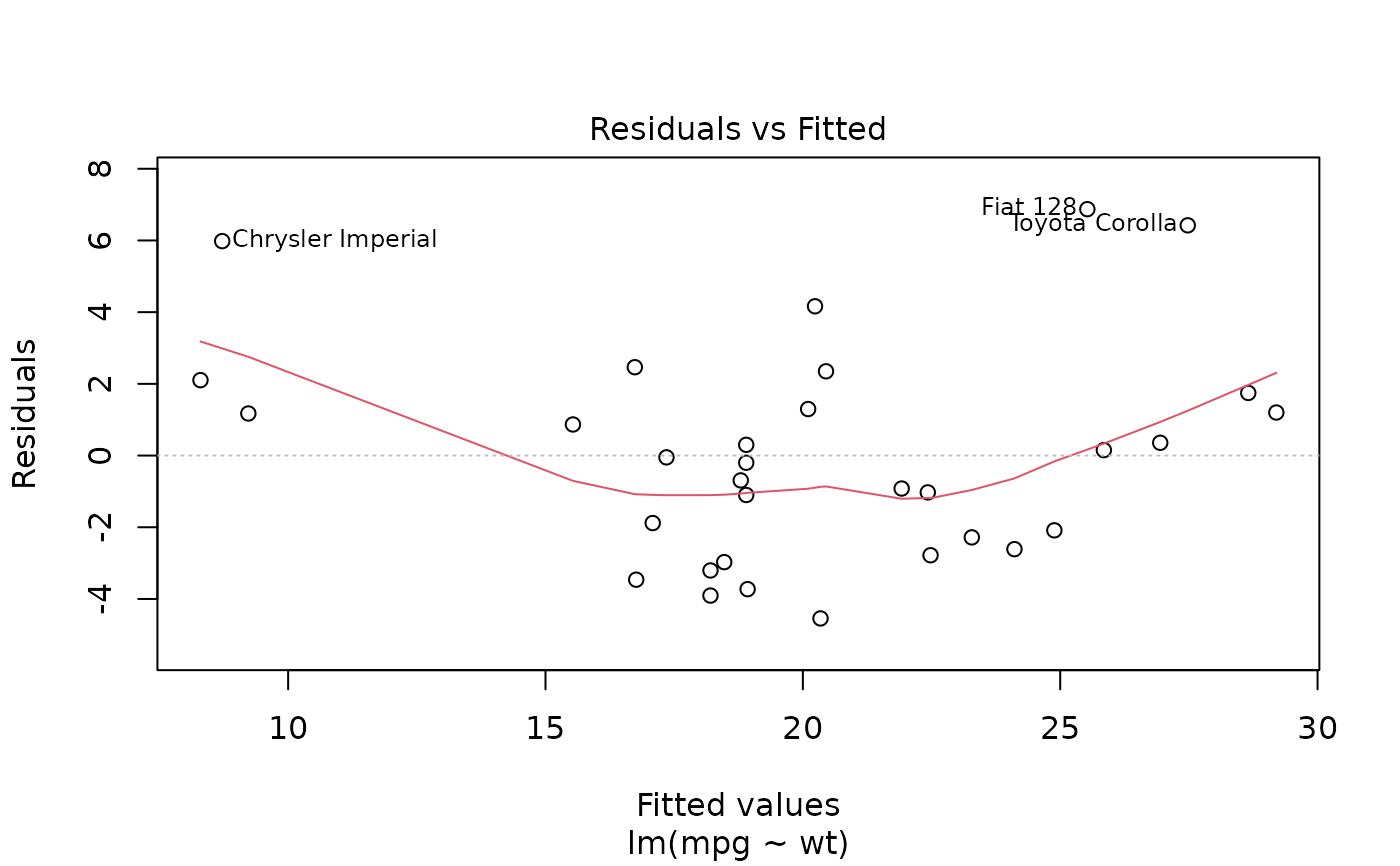
head(fortify(mod))
#> Warning: `fortify(<lm>)` was deprecated in ggplot2 4.0.0.
#> ℹ Please use `broom::augment(<lm>)` instead.
#> mpg wt .hat .sigma .cooksd .fitted
#> Mazda RX4 21.0 2.620 0.04326896 3.067494 1.327407e-02 23.28261
#> Mazda RX4 Wag 21.0 2.875 0.03519677 3.093068 1.723963e-03 21.91977
#> Datsun 710 22.8 2.320 0.05837573 3.072127 1.543937e-02 24.88595
#> Hornet 4 Drive 21.4 3.215 0.03125017 3.088268 3.020558e-03 20.10265
#> Hornet Sportabout 18.7 3.440 0.03292182 3.097722 7.599578e-05 18.90014
#> Valiant 18.1 3.460 0.03323551 3.095184 9.210650e-04 18.79325
#> .resid .stdresid
#> Mazda RX4 -2.2826106 -0.76616765
#> Mazda RX4 Wag -0.9197704 -0.30743051
#> Datsun 710 -2.0859521 -0.70575249
#> Hornet 4 Drive 1.2973499 0.43275114
#> Hornet Sportabout -0.2001440 -0.06681879
#> Valiant -0.6932545 -0.23148309
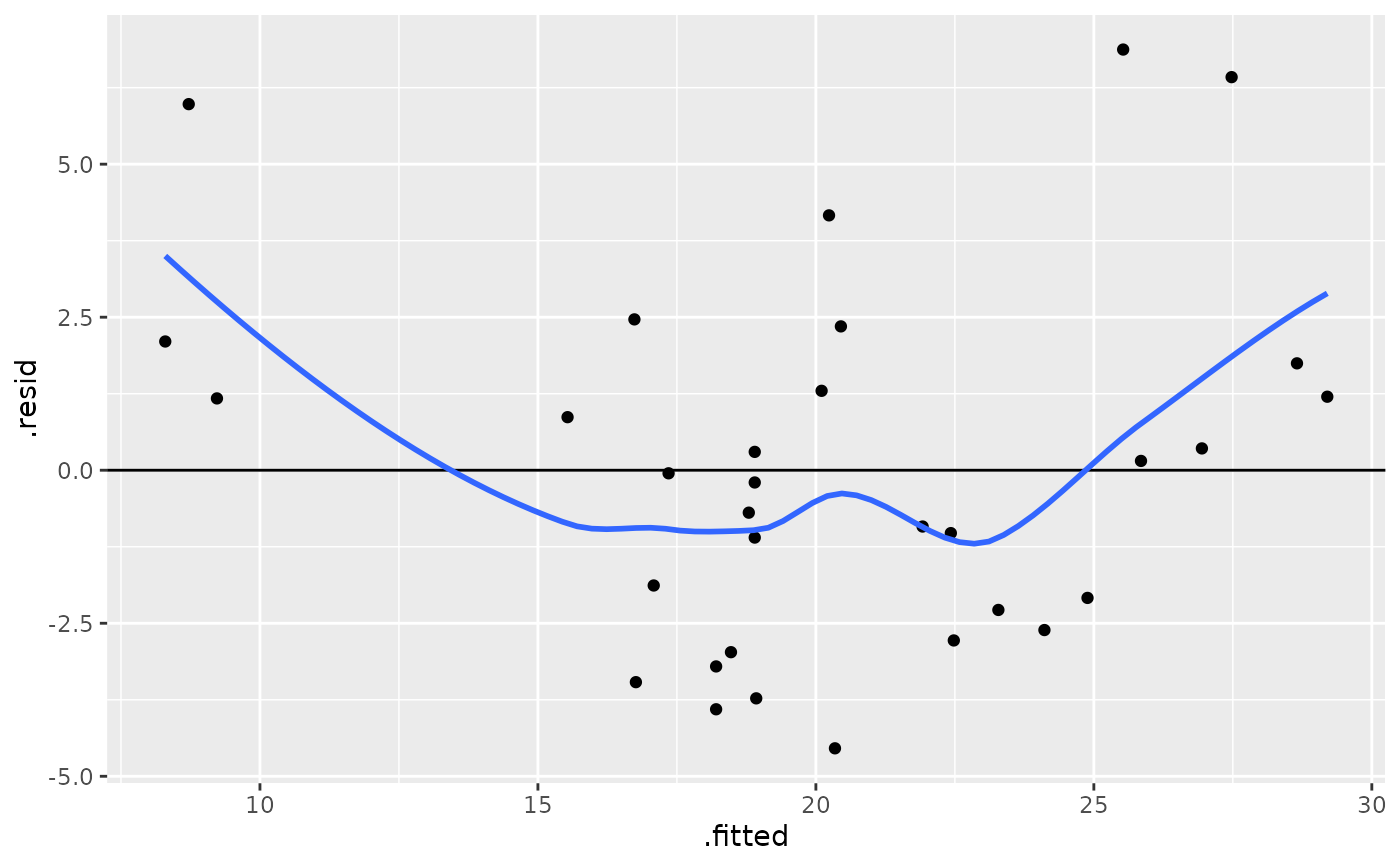
# Using augment to convert model to ready-to-plot data
ggplot(augment(mod), aes(.fitted, .resid)) +
geom_point() +
geom_hline(yintercept = 0) +
geom_smooth(se = FALSE)
#> `geom_smooth()` using method = 'loess' and formula = 'y ~ x'
 # Colouring by original data not included in the model
ggplot(augment(mod, mtcars), aes(.fitted, .std.resid, colour = factor(cyl))) +
geom_point()
# Colouring by original data not included in the model
ggplot(augment(mod, mtcars), aes(.fitted, .std.resid, colour = factor(cyl))) +
geom_point()