This guide is version of guide_colourbar() for binned colour and fill
scales. It shows areas between breaks as a single constant colour instead of
the gradient known from the colourbar counterpart.
Usage
guide_coloursteps(
  title = waiver(),
  theme = NULL,
  alpha = NA,
  angle = NULL,
  even.steps = TRUE,
  show.limits = NULL,
  direction = NULL,
  position = NULL,
  reverse = FALSE,
  order = 0,
  available_aes = c("colour", "color", "fill"),
  ...
)

guide_colorsteps(
  title = waiver(),
  theme = NULL,
  alpha = NA,
  angle = NULL,
  even.steps = TRUE,
  show.limits = NULL,
  direction = NULL,
  position = NULL,
  reverse = FALSE,
  order = 0,
  available_aes = c("colour", "color", "fill"),
  ...
)
Arguments
- title
A character string or expression indicating a title of guide. If
NULL, the title is not shown. By default (waiver()), the name of the scale object or the name specified inlabs()is used for the title.- theme
A
themeobject to style the guide individually or differently from the plot's theme settings. Thethemeargument in the guide partially overrides, and is combined with, the plot's theme. Arguments that apply to a single legend are respected, most of which have thelegend-prefix. Arguments that apply to combined legends (the legend box) are ignored, includinglegend.position,legend.justification.*,legend.locationandlegend.box.*.- alpha
A numeric between 0 and 1 setting the colour transparency of the bar. Use
NAto preserve the alpha encoded in the colour itself (default).- angle
Overrules the theme settings to automatically apply appropriate
hjustandvjustfor angled legend text. Can be a single number representing the text angle in degrees, orNULLto not overrule the settings (default).- even.steps
Should the rendered size of the bins be equal, or should they be proportional to their length in the data space? Defaults to
TRUE- show.limits
Logical. Should the limits of the scale be shown with labels and ticks. Default is
NULLmeaning it will take the value from the scale. This argument is ignored iflabelsis given as a vector of values. If one or both of the limits is also given inbreaksit will be shown irrespective of the value ofshow.limits.- direction
A character string indicating the direction of the guide. One of "horizontal" or "vertical."
- position
A character string indicating where the legend should be placed relative to the plot panels. One of "top", "right", "bottom", "left", or "inside".
- reverse
logical. If
TRUEthe colourbar is reversed. By default, the highest value is on the top and the lowest value is on the bottom- order
positive integer less than 99 that specifies the order of this guide among multiple guides. This controls the order in which multiple guides are displayed, not the contents of the guide itself. If 0 (default), the order is determined by a secret algorithm.
- available_aes
A vector of character strings listing the aesthetics for which a colourbar can be drawn.
- ...
ignored.
Use with discrete scale
This guide is intended to show binned data and work together with ggplot2's
binning scales. However, it is sometimes desirable to perform the binning in
a separate step, either as part of a stat (e.g. stat_contour_filled()) or
prior to the visualisation. If you want to use this guide for discrete data
the levels must follow the naming scheme implemented by base::cut(). This
means that a bin must be encoded as "(<lower>, <upper>]" with <lower>
giving the lower bound of the bin and <upper> giving the upper bound
("[<lower>, <upper>)" is also accepted). If you use base::cut() to
perform the binning everything should work as expected, if not, some recoding
may be needed.
See also
The binned legend section of the online ggplot2 book.
Other guides:
guide_bins(),
guide_colourbar(),
guide_legend(),
guides()
Examples
df <- expand.grid(X1 = 1:10, X2 = 1:10)
df$value <- df$X1 * df$X2
p <- ggplot(df, aes(X1, X2)) + geom_tile(aes(fill = value))
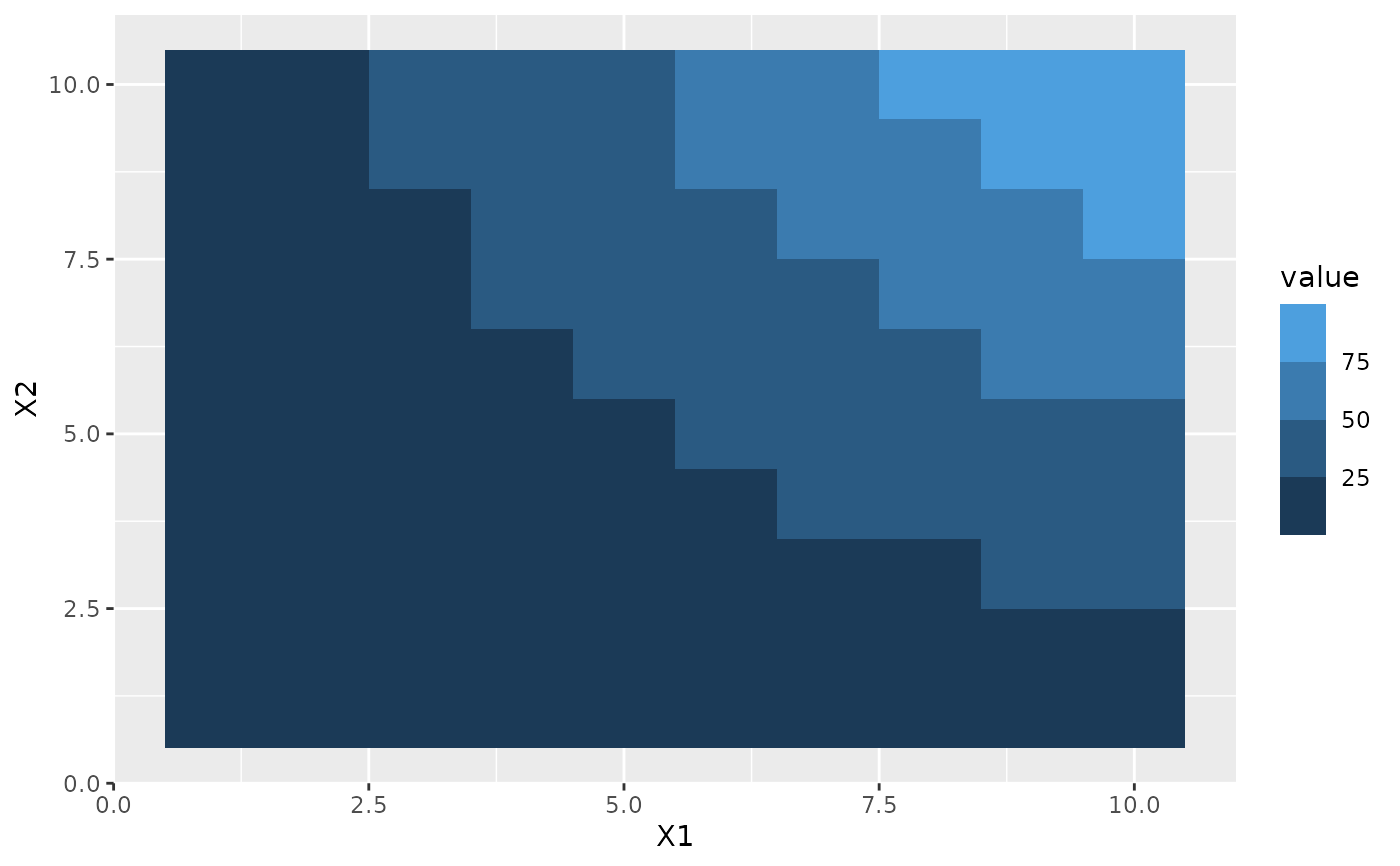
# Coloursteps guide is the default for binned colour scales
p + scale_fill_binned()
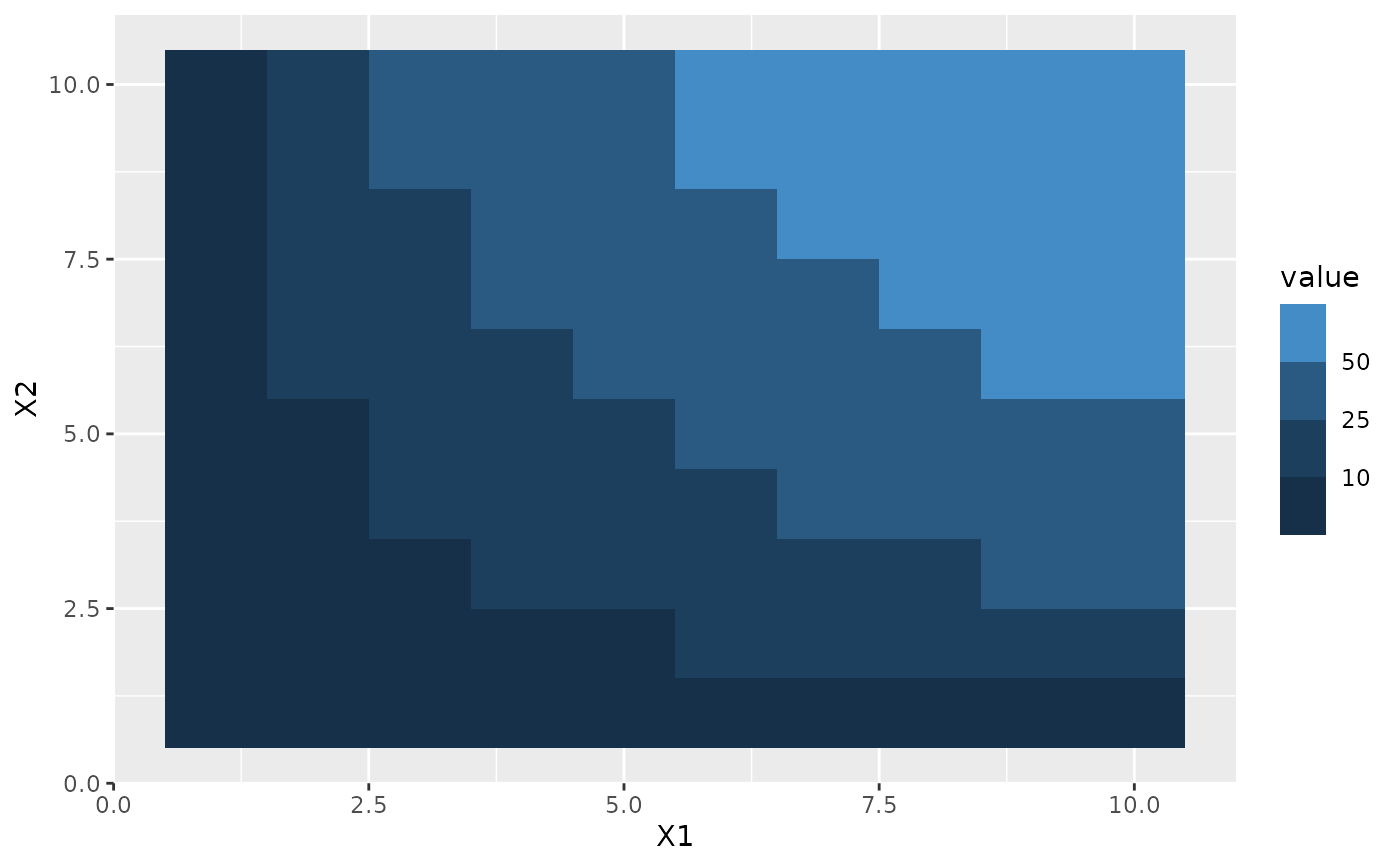
 # By default each bin in the guide is the same size irrespectively of how
# their sizes relate in data space
p + scale_fill_binned(breaks = c(10, 25, 50))
# By default each bin in the guide is the same size irrespectively of how
# their sizes relate in data space
p + scale_fill_binned(breaks = c(10, 25, 50))
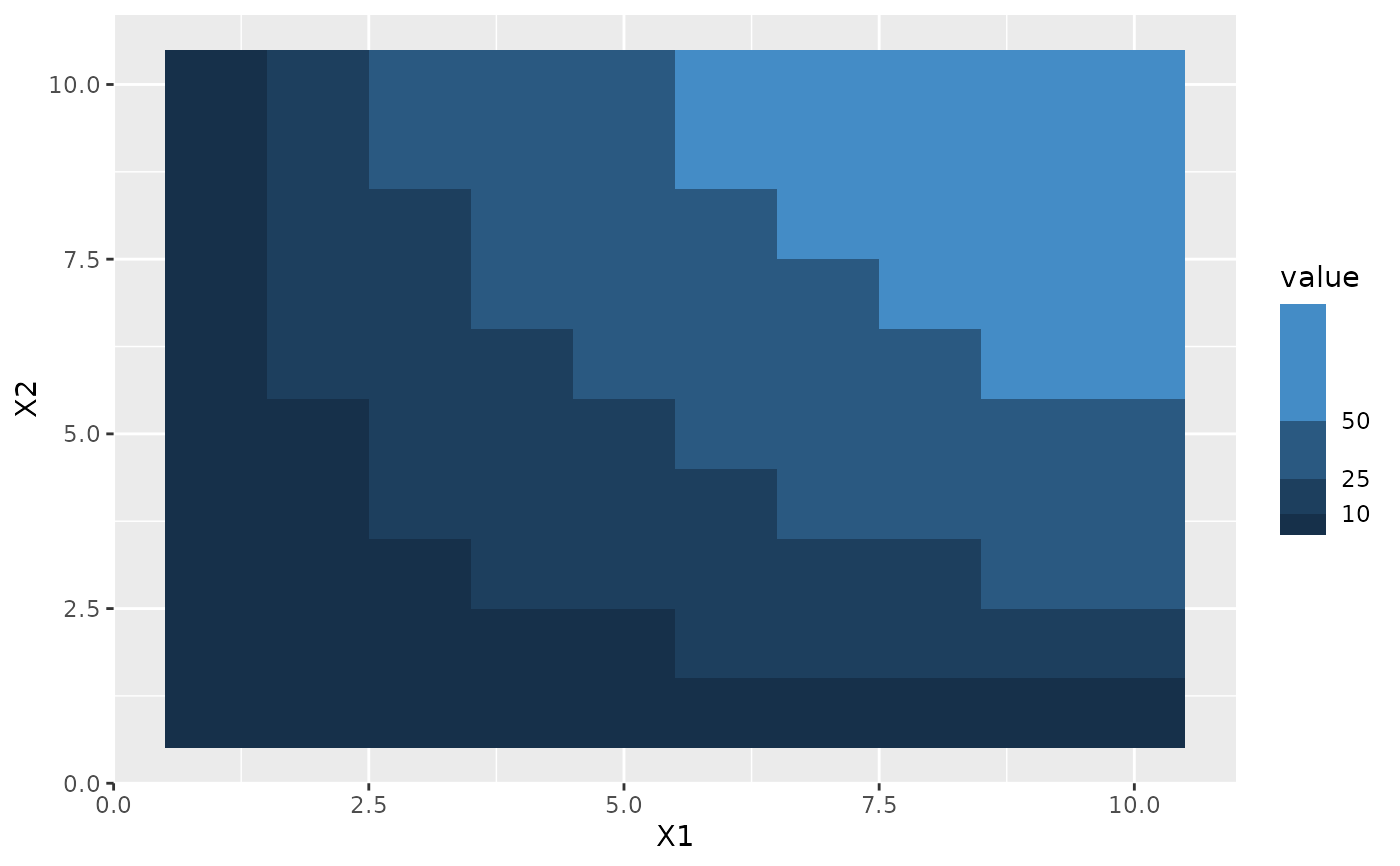
 # This can be changed with the `even.steps` argument
p + scale_fill_binned(
breaks = c(10, 25, 50),
guide = guide_coloursteps(even.steps = FALSE)
)
# This can be changed with the `even.steps` argument
p + scale_fill_binned(
breaks = c(10, 25, 50),
guide = guide_coloursteps(even.steps = FALSE)
)
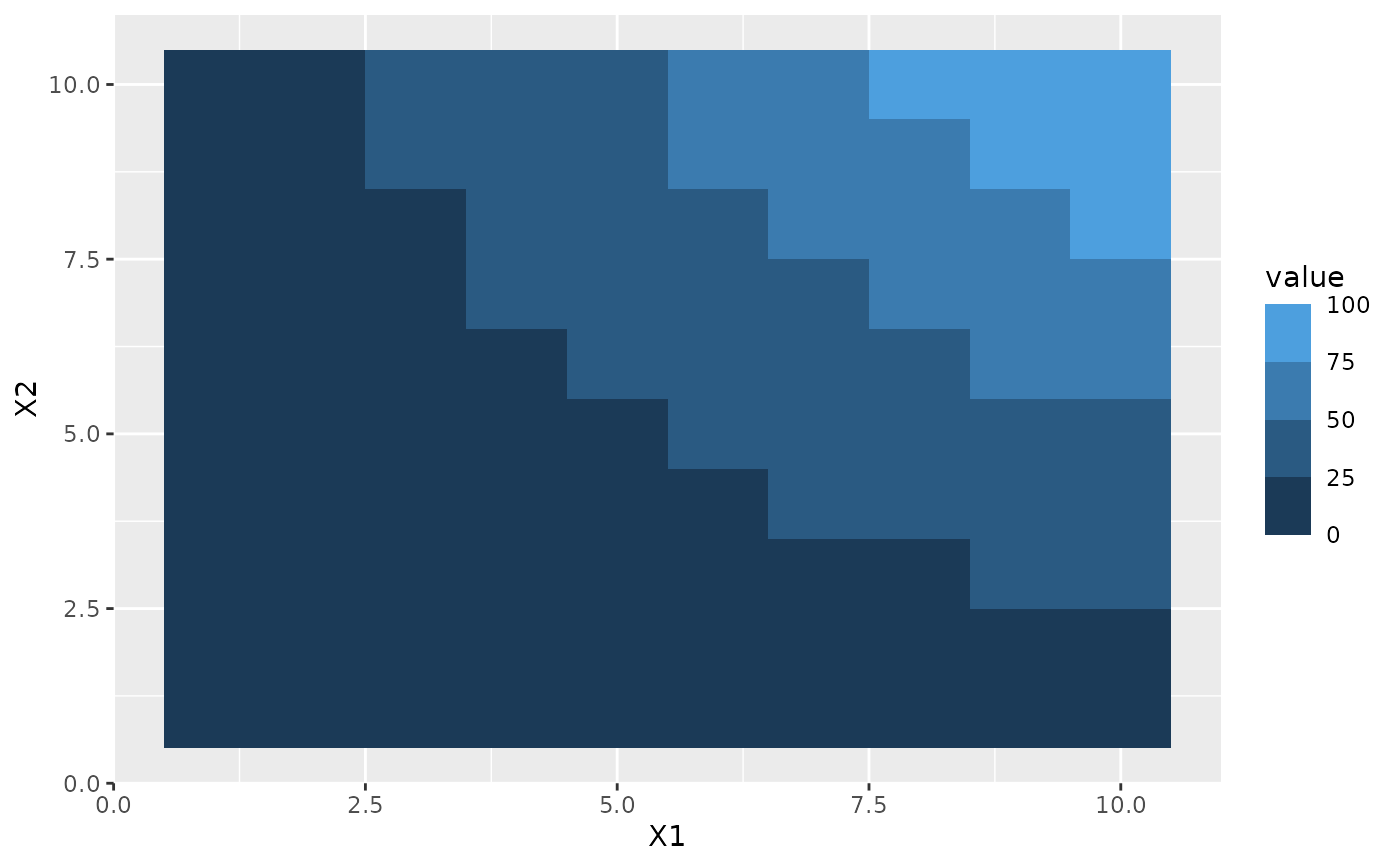
 # By default the limits is not shown, but this can be changed
p + scale_fill_binned(guide = guide_coloursteps(show.limits = TRUE))
# By default the limits is not shown, but this can be changed
p + scale_fill_binned(guide = guide_coloursteps(show.limits = TRUE))
 # (can also be set in the scale)
p + scale_fill_binned(show.limits = TRUE)
# (can also be set in the scale)
p + scale_fill_binned(show.limits = TRUE)
