Colour bar guide shows continuous colour scales mapped onto values.
Colour bar is available with scale_fill and scale_colour.
Usage
guide_colourbar(
  title = waiver(),
  theme = NULL,
  nbin = NULL,
  display = "raster",
  raster = deprecated(),
  alpha = NA,
  draw.ulim = TRUE,
  draw.llim = TRUE,
  angle = NULL,
  position = NULL,
  direction = NULL,
  reverse = FALSE,
  order = 0,
  available_aes = c("colour", "color", "fill"),
  ...
)

guide_colorbar(
  title = waiver(),
  theme = NULL,
  nbin = NULL,
  display = "raster",
  raster = deprecated(),
  alpha = NA,
  draw.ulim = TRUE,
  draw.llim = TRUE,
  angle = NULL,
  position = NULL,
  direction = NULL,
  reverse = FALSE,
  order = 0,
  available_aes = c("colour", "color", "fill"),
  ...
)
Arguments
- title
A character string or expression indicating a title of guide. If
NULL, the title is not shown. By default (waiver()), the name of the scale object or the name specified inlabs()is used for the title.- theme
A
themeobject to style the guide individually or differently from the plot's theme settings. Thethemeargument in the guide partially overrides, and is combined with, the plot's theme. Arguments that apply to a single legend are respected, most of which have thelegend-prefix. Arguments that apply to combined legends (the legend box) are ignored, includinglegend.position,legend.justification.*,legend.locationandlegend.box.*.- nbin
A numeric specifying the number of bins for drawing the colourbar. A smoother colourbar results from a larger value.
- display
A string indicating a method to display the colourbar. Can be one of the following:
"raster"to display as a bitmap image."rectangles"to display as a series of rectangles."gradient"to display as a linear gradient.
Note that not all devices are able to render rasters and gradients.
- raster
![[Deprecated]](figures/lifecycle-deprecated.svg) A logical. If
A logical. If TRUEthen the colourbar is rendered as a raster object. IfFALSEthen the colourbar is rendered as a set of rectangles. Note that not all graphics devices are capable of rendering raster image.- alpha
A numeric between 0 and 1 setting the colour transparency of the bar. Use
NAto preserve the alpha encoded in the colour itself (default).- draw.ulim
A logical specifying if the upper limit tick marks should be visible.
- draw.llim
A logical specifying if the lower limit tick marks should be visible.
- angle
Overrules the theme settings to automatically apply appropriate
hjustandvjustfor angled legend text. Can be a single number representing the text angle in degrees, orNULLto not overrule the settings (default).- position
A character string indicating where the legend should be placed relative to the plot panels. One of "top", "right", "bottom", "left", or "inside".
- direction
A character string indicating the direction of the guide. One of "horizontal" or "vertical."
- reverse
logical. If
TRUEthe colourbar is reversed. By default, the highest value is on the top and the lowest value is on the bottom- order
positive integer less than 99 that specifies the order of this guide among multiple guides. This controls the order in which multiple guides are displayed, not the contents of the guide itself. If 0 (default), the order is determined by a secret algorithm.
- available_aes
A vector of character strings listing the aesthetics for which a colourbar can be drawn.
- ...
ignored.
Details
Guides can be specified in each scale_* or in guides().
guide="legend" in scale_* is syntactic sugar for
guide=guide_legend() (e.g. scale_colour_manual(guide = "legend")).
As for how to specify the guide for each scale in more detail,
see guides().
The legend.ticks.length theme option can be set to a length 2 unit to
control ticks at the right/bottom and left/top sides independently.
See also
The continuous legend section of the online ggplot2 book.
Other guides:
guide_bins(),
guide_coloursteps(),
guide_legend(),
guides()
Examples
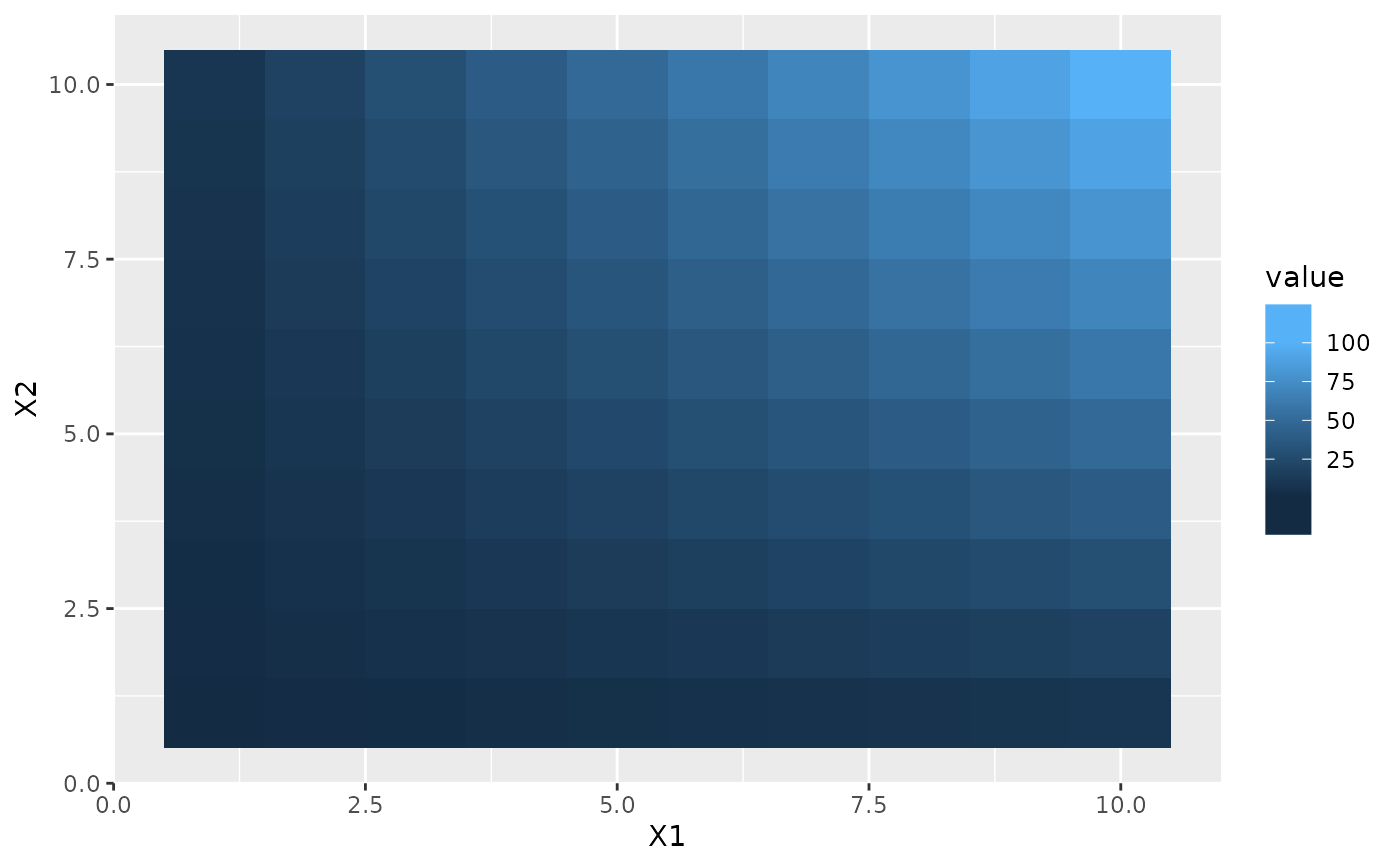
df <- expand.grid(X1 = 1:10, X2 = 1:10)
df$value <- df$X1 * df$X2
p1 <- ggplot(df, aes(X1, X2)) + geom_tile(aes(fill = value))
p2 <- p1 + geom_point(aes(size = value))
# Basic form
p1 + scale_fill_continuous(guide = "colourbar")
 p1 + scale_fill_continuous(guide = guide_colourbar())
 p1 + guides(fill = guide_colourbar())
 # Control styles
# bar size
p1 + guides(fill = guide_colourbar(theme = theme(
legend.key.width = unit(0.5, "lines"),
legend.key.height = unit(10, "lines")
)))
# Control styles
# bar size
p1 + guides(fill = guide_colourbar(theme = theme(
legend.key.width = unit(0.5, "lines"),
legend.key.height = unit(10, "lines")
)))
 # no label
p1 + guides(fill = guide_colourbar(theme = theme(
legend.text = element_blank()
)))
# no label
p1 + guides(fill = guide_colourbar(theme = theme(
legend.text = element_blank()
)))
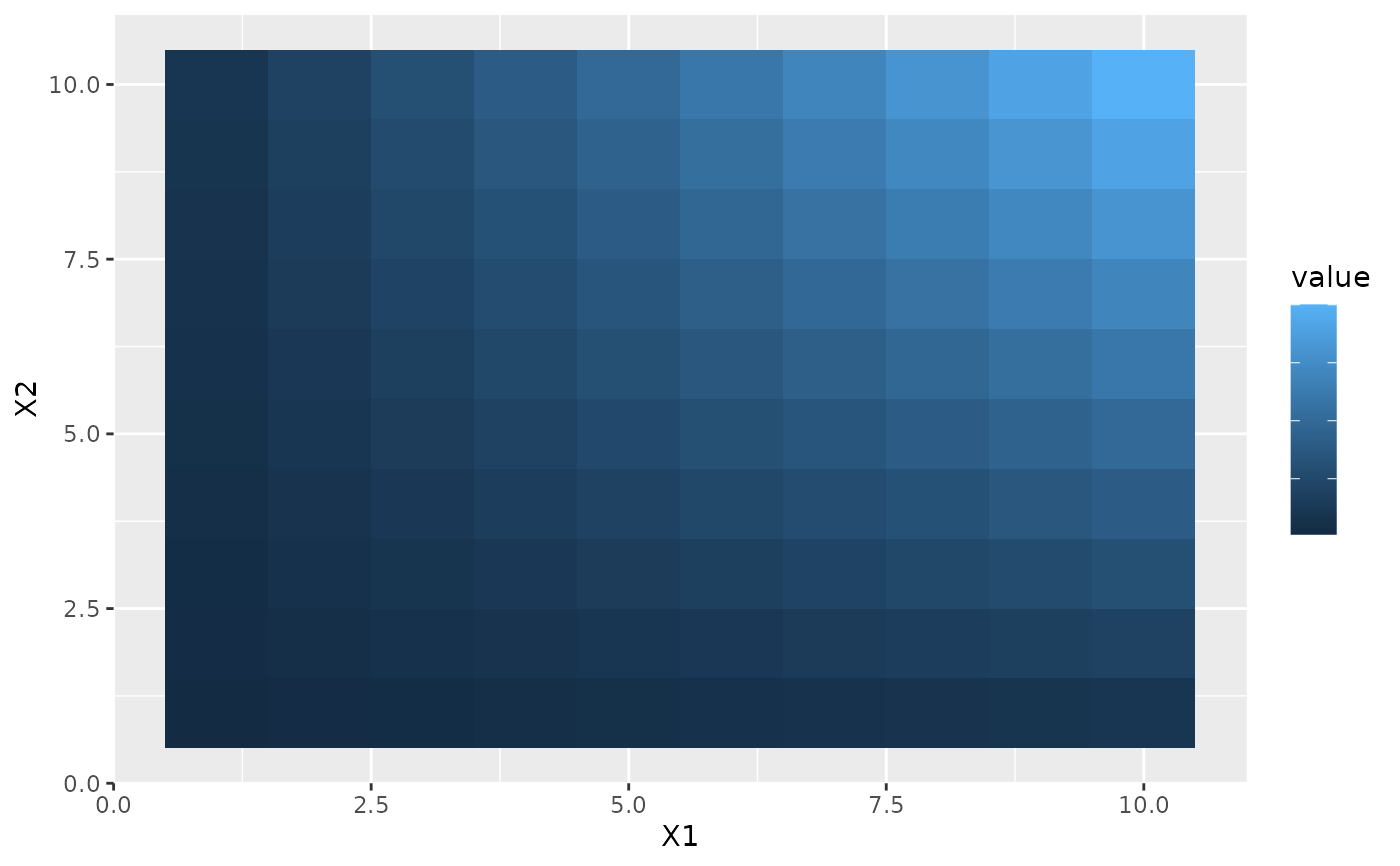 # no tick marks
p1 + guides(fill = guide_colourbar(theme = theme(
legend.ticks = element_blank()
)))
# no tick marks
p1 + guides(fill = guide_colourbar(theme = theme(
legend.ticks = element_blank()
)))
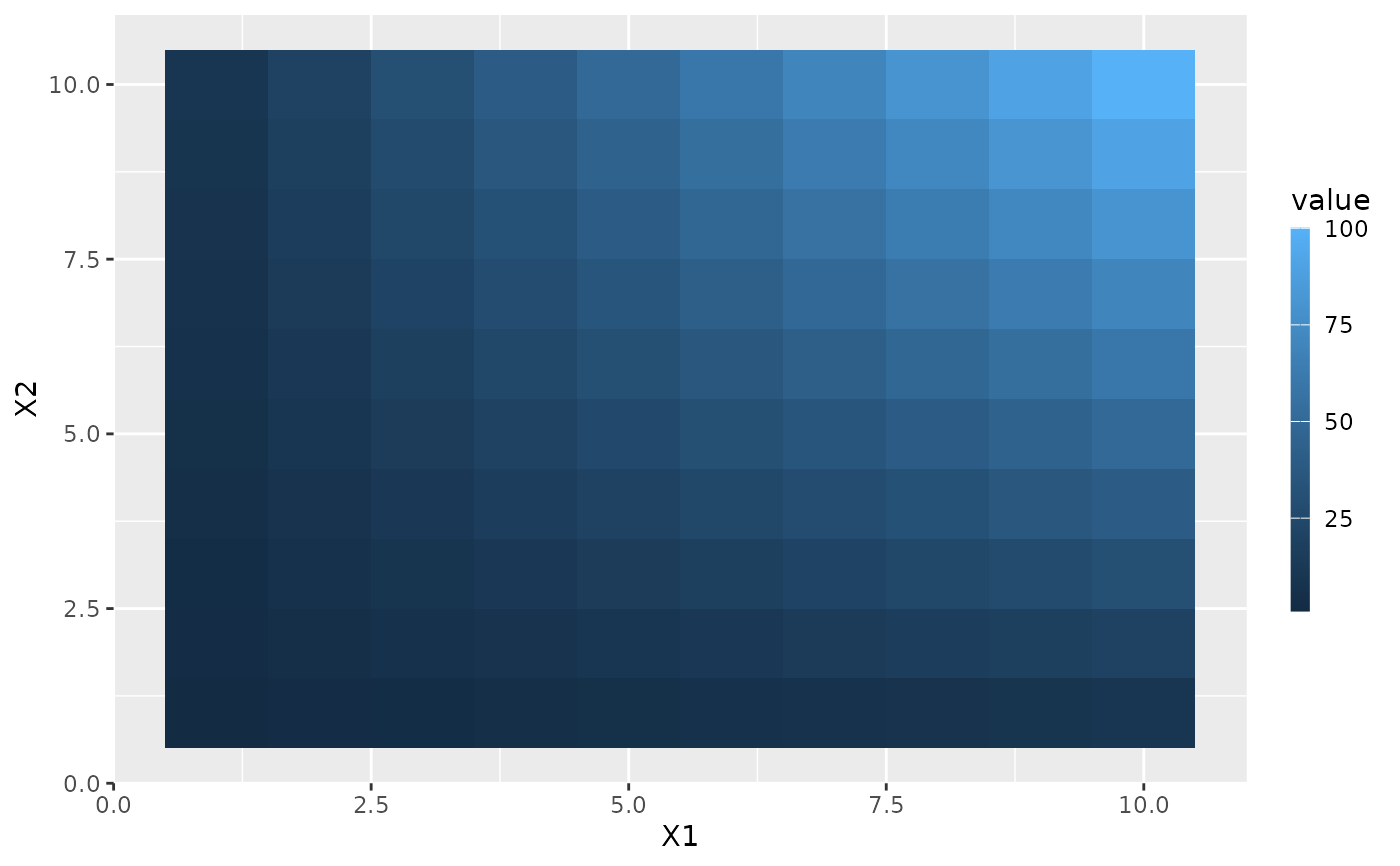
 # label position
p1 + guides(fill = guide_colourbar(theme = theme(
legend.text.position = "left"
)))
# label position
p1 + guides(fill = guide_colourbar(theme = theme(
legend.text.position = "left"
)))
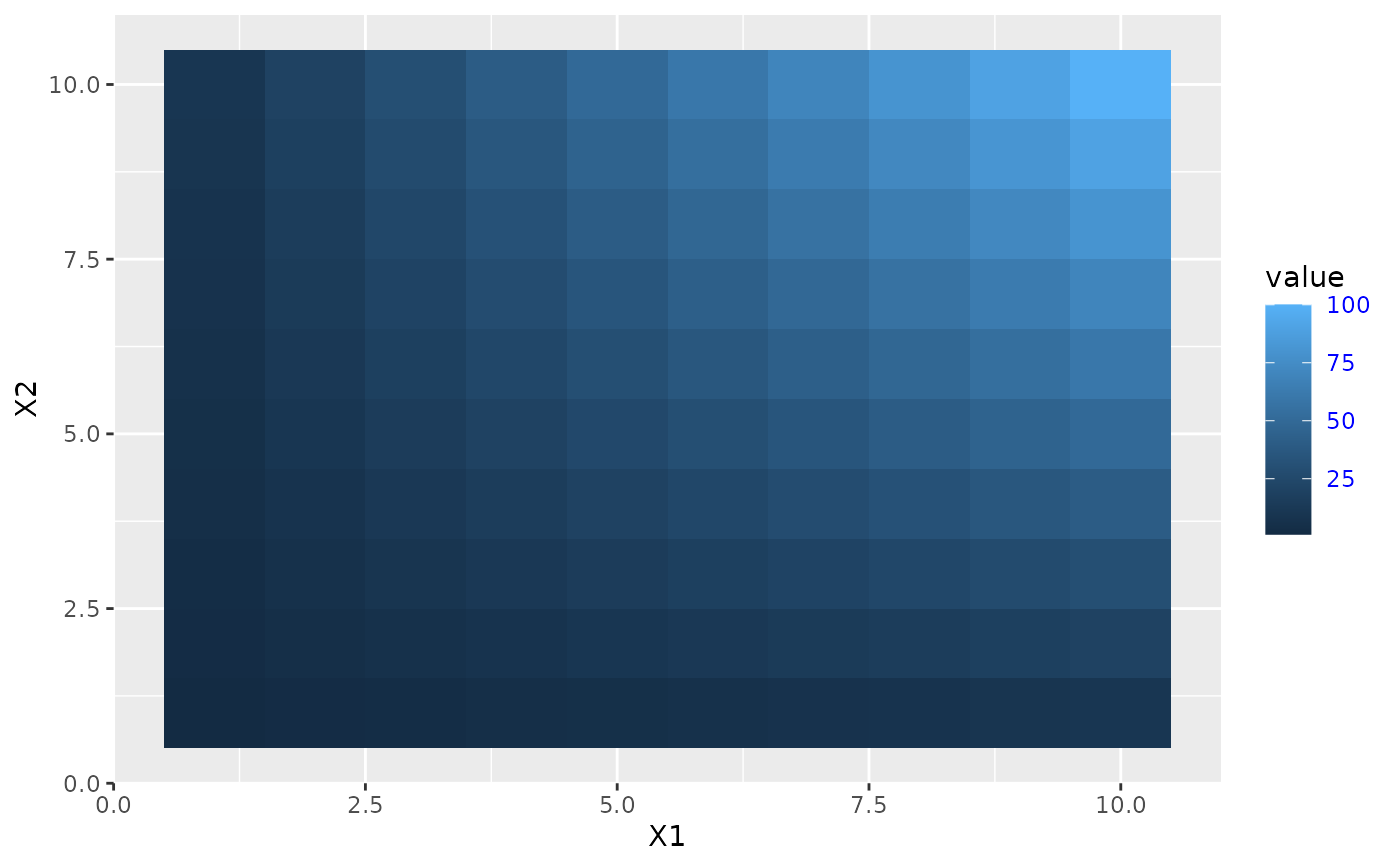
 # label theme
p1 + guides(fill = guide_colourbar(theme = theme(
legend.text = element_text(colour = "blue", angle = 0)
)))
# label theme
p1 + guides(fill = guide_colourbar(theme = theme(
legend.text = element_text(colour = "blue", angle = 0)
)))
 # small number of bins
p1 + guides(fill = guide_colourbar(nbin = 3))
# small number of bins
p1 + guides(fill = guide_colourbar(nbin = 3))
 # large number of bins
p1 + guides(fill = guide_colourbar(nbin = 100))
# large number of bins
p1 + guides(fill = guide_colourbar(nbin = 100))
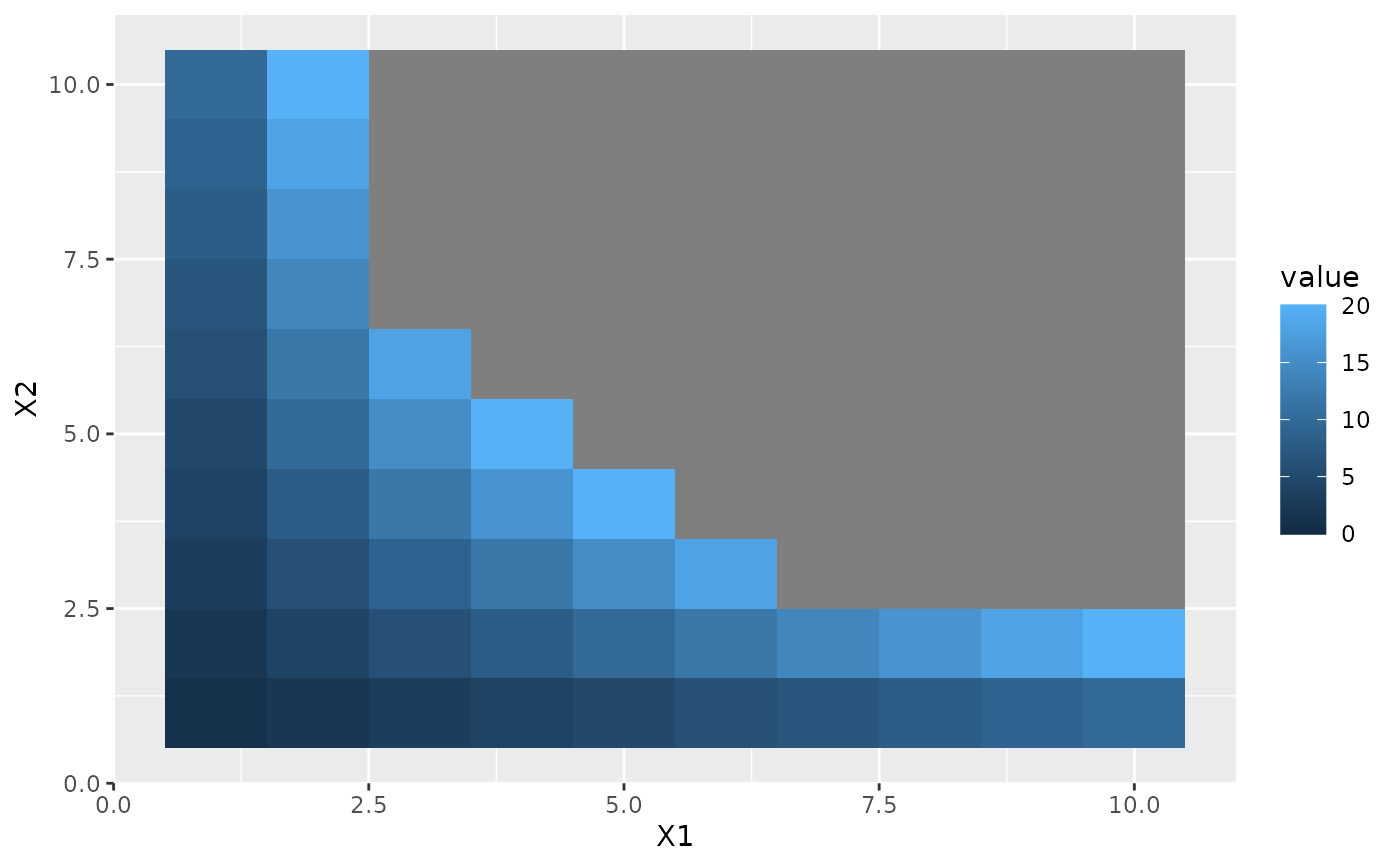
 # make top- and bottom-most ticks invisible
p1 +
scale_fill_continuous(
limits = c(0,20), breaks = c(0, 5, 10, 15, 20),
guide = guide_colourbar(nbin = 100, draw.ulim = FALSE, draw.llim = FALSE)
)
# make top- and bottom-most ticks invisible
p1 +
scale_fill_continuous(
limits = c(0,20), breaks = c(0, 5, 10, 15, 20),
guide = guide_colourbar(nbin = 100, draw.ulim = FALSE, draw.llim = FALSE)
)
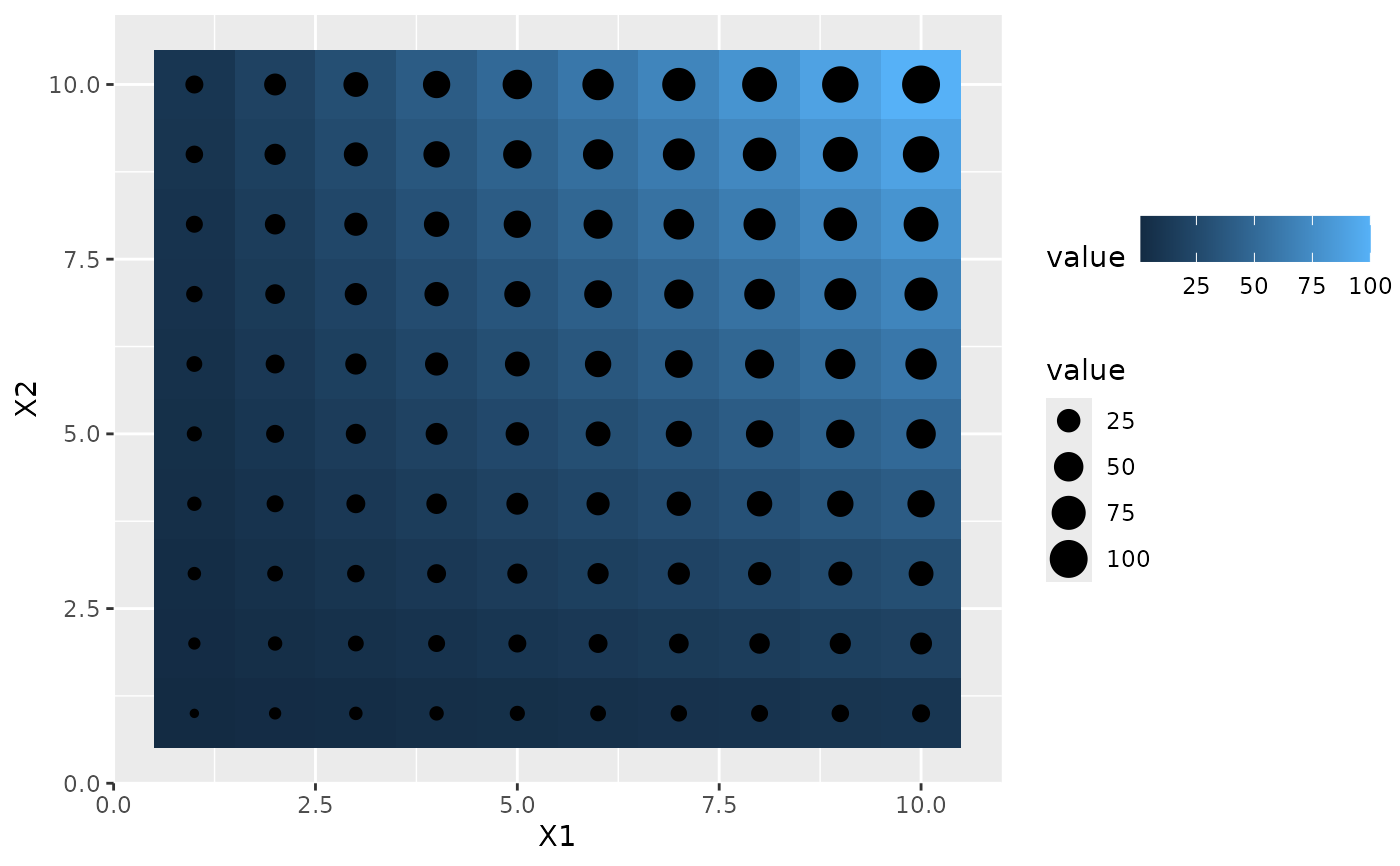
 # guides can be controlled independently
p2 +
scale_fill_continuous(guide = "colourbar") +
scale_size(guide = "legend")
# guides can be controlled independently
p2 +
scale_fill_continuous(guide = "colourbar") +
scale_size(guide = "legend")
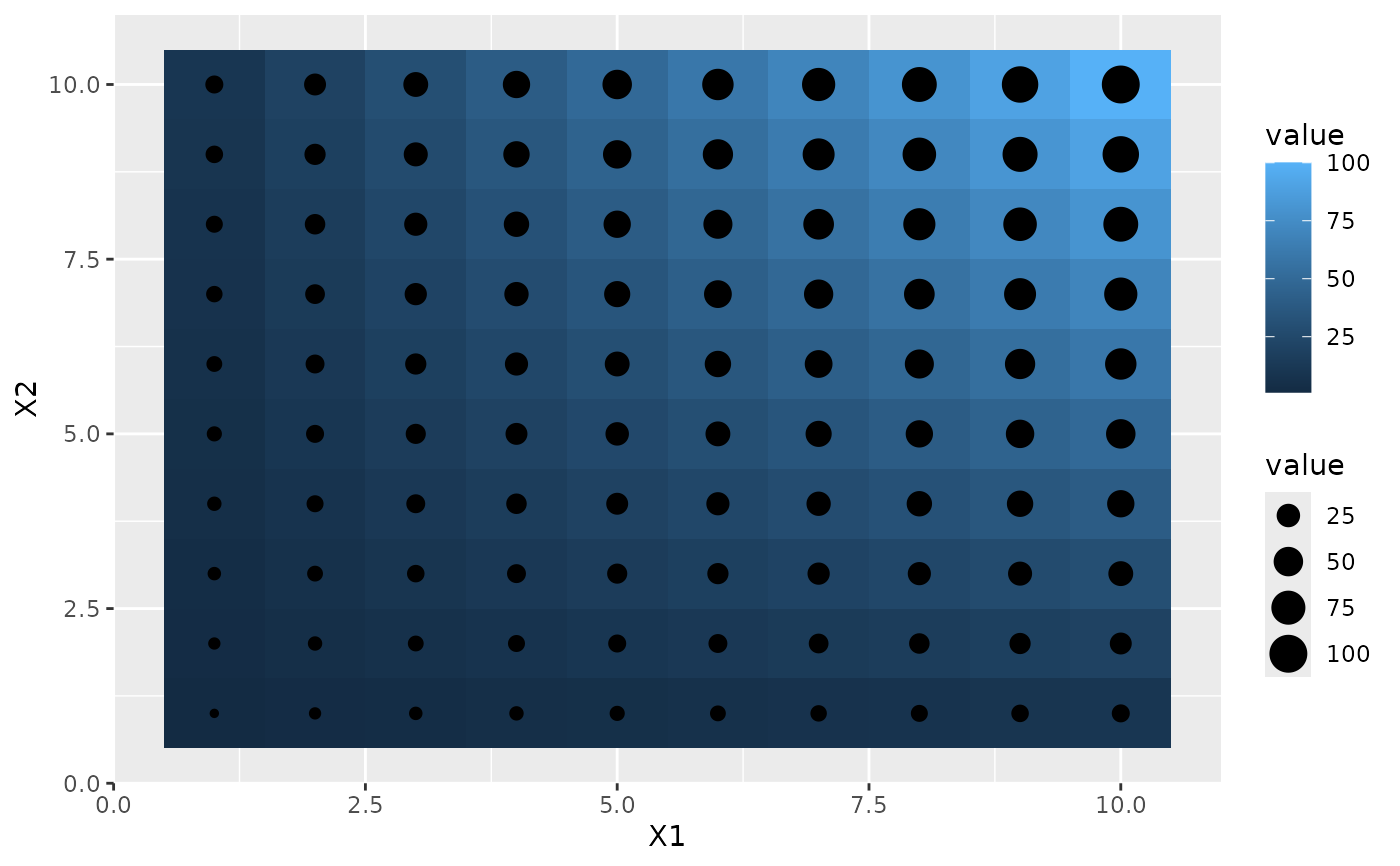 p2 + guides(fill = "colourbar", size = "legend")
 p2 +
scale_fill_continuous(guide = guide_colourbar(theme = theme(
legend.direction = "horizontal"
))) +
scale_size(guide = guide_legend(theme = theme(
legend.direction = "vertical"
)))
p2 +
scale_fill_continuous(guide = guide_colourbar(theme = theme(
legend.direction = "horizontal"
))) +
scale_size(guide = guide_legend(theme = theme(
legend.direction = "vertical"
)))