![[Superseded]](figures/lifecycle-superseded.svg)
This function is superseded because in many cases, coord_flip() can easily
be replaced by swapping the x and y aesthetics, or optionally setting the
orientation argument in geom and stat layers.
coord_flip() is useful for geoms and statistics that do not support
the orientation setting, and converting the display of y conditional on x,
to x conditional on y.
Arguments
- xlim, ylim
Limits for the x and y axes.
- expand
If
TRUE, the default, adds a small expansion factor to the limits to ensure that data and axes don't overlap. IfFALSE, limits are taken exactly from the data orxlim/ylim. Giving a logical vector will separately control the expansion for the four directions (top, left, bottom and right). Theexpandargument will be recycled to length 4 if necessary. Alternatively, can be a named logical vector to control a single direction, e.g.expand = c(bottom = FALSE).- clip
Should drawing be clipped to the extent of the plot panel? A setting of
"on"(the default) means yes, and a setting of"off"means no. In most cases, the default of"on"should not be changed, as settingclip = "off"can cause unexpected results. It allows drawing of data points anywhere on the plot, including in the plot margins. If limits are set viaxlimandylimand some data points fall outside those limits, then those data points may show up in places such as the axes, the legend, the plot title, or the plot margins.
Details
Coordinate systems interact with many parts of the plotting system. You can
expect the following for coord_flip():
It does not change the facet order in
facet_grid()orfacet_wrap().The
scale_x_*()functions apply to the vertical direction, whereasscale_y_*()functions apply to the horizontal direction. The same holds for thexlimandylimarguments ofcoord_flip()and thexlim()andylim()functions.The x-axis theme settings, such as
axis.line.xapply to the horizontal direction. The y-axis theme settings, such asaxis.text.yapply to the vertical direction.
Examples
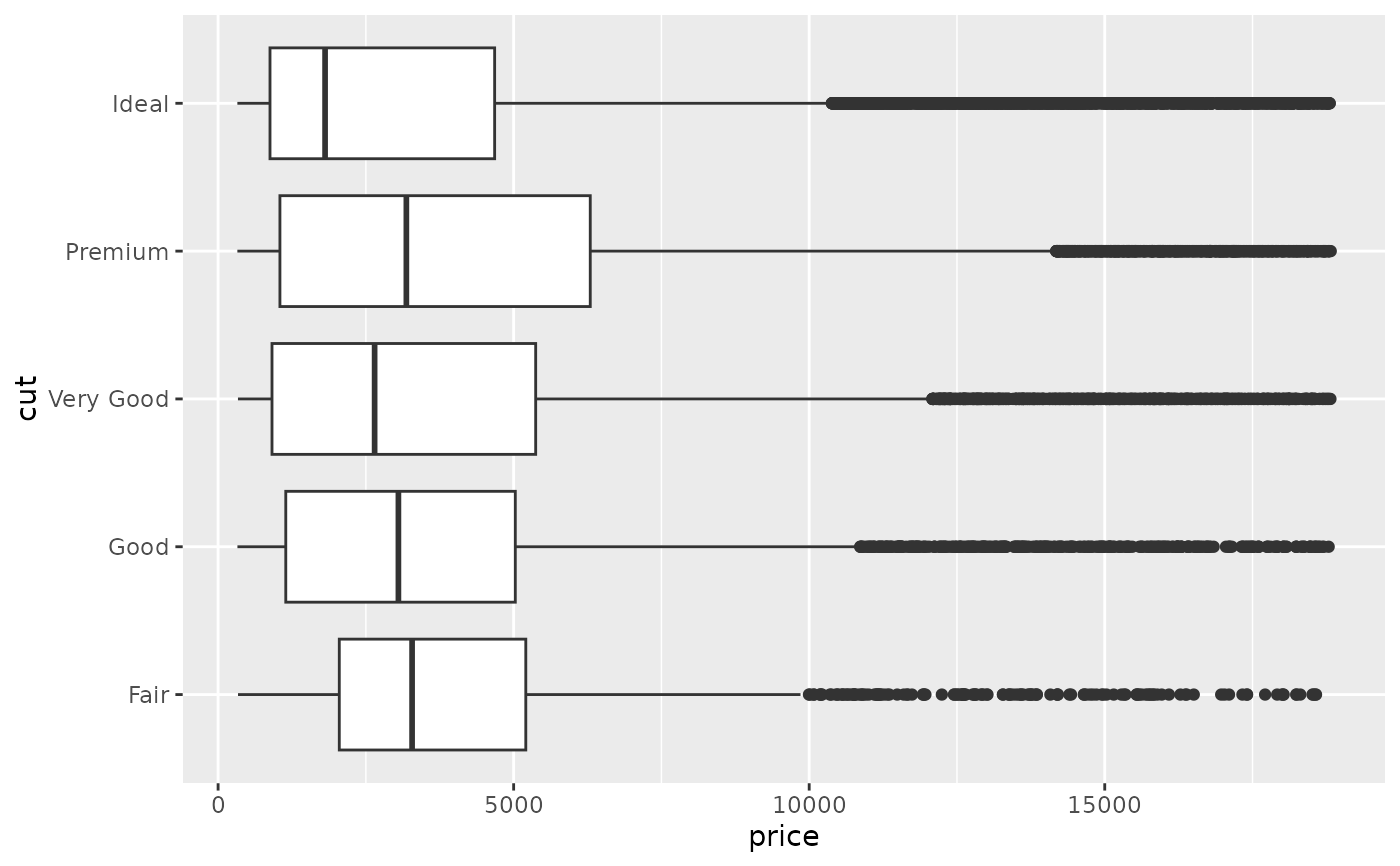
# The preferred method of creating horizontal instead of vertical boxplots
ggplot(diamonds, aes(price, cut)) +
geom_boxplot()
 # Using `coord_flip()` to make the same plot
ggplot(diamonds, aes(cut, price)) +
geom_boxplot() +
coord_flip()
# Using `coord_flip()` to make the same plot
ggplot(diamonds, aes(cut, price)) +
geom_boxplot() +
coord_flip()
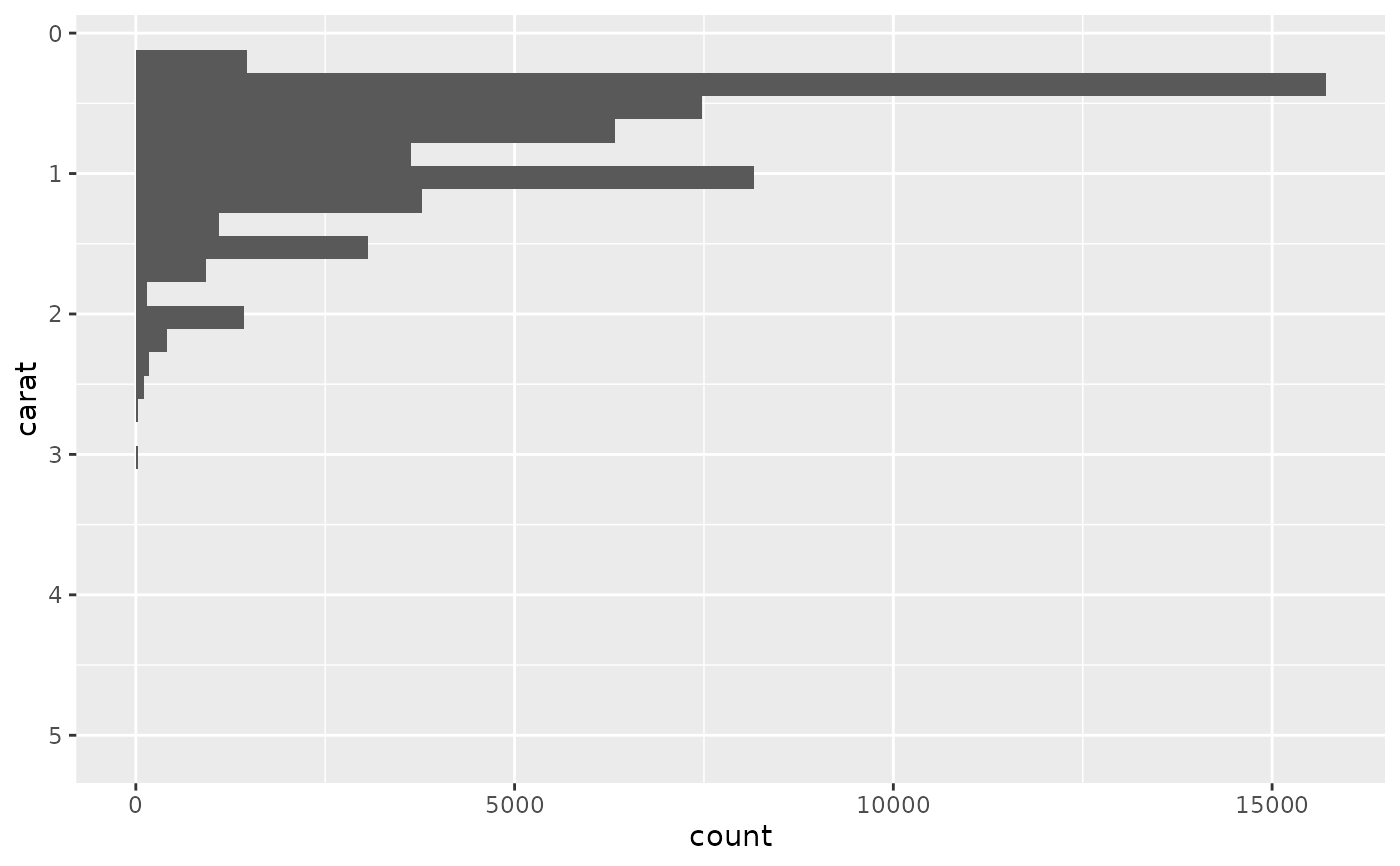
 # With swapped aesthetics, the y-scale controls the left axis
ggplot(diamonds, aes(y = carat)) +
geom_histogram() +
scale_y_reverse()
#> `stat_bin()` using `bins = 30`. Pick better value `binwidth`.
# With swapped aesthetics, the y-scale controls the left axis
ggplot(diamonds, aes(y = carat)) +
geom_histogram() +
scale_y_reverse()
#> `stat_bin()` using `bins = 30`. Pick better value `binwidth`.
 # In `coord_flip()`, the x-scale controls the left axis
ggplot(diamonds, aes(carat)) +
geom_histogram() +
coord_flip() +
scale_x_reverse()
#> `stat_bin()` using `bins = 30`. Pick better value `binwidth`.
# In `coord_flip()`, the x-scale controls the left axis
ggplot(diamonds, aes(carat)) +
geom_histogram() +
coord_flip() +
scale_x_reverse()
#> `stat_bin()` using `bins = 30`. Pick better value `binwidth`.
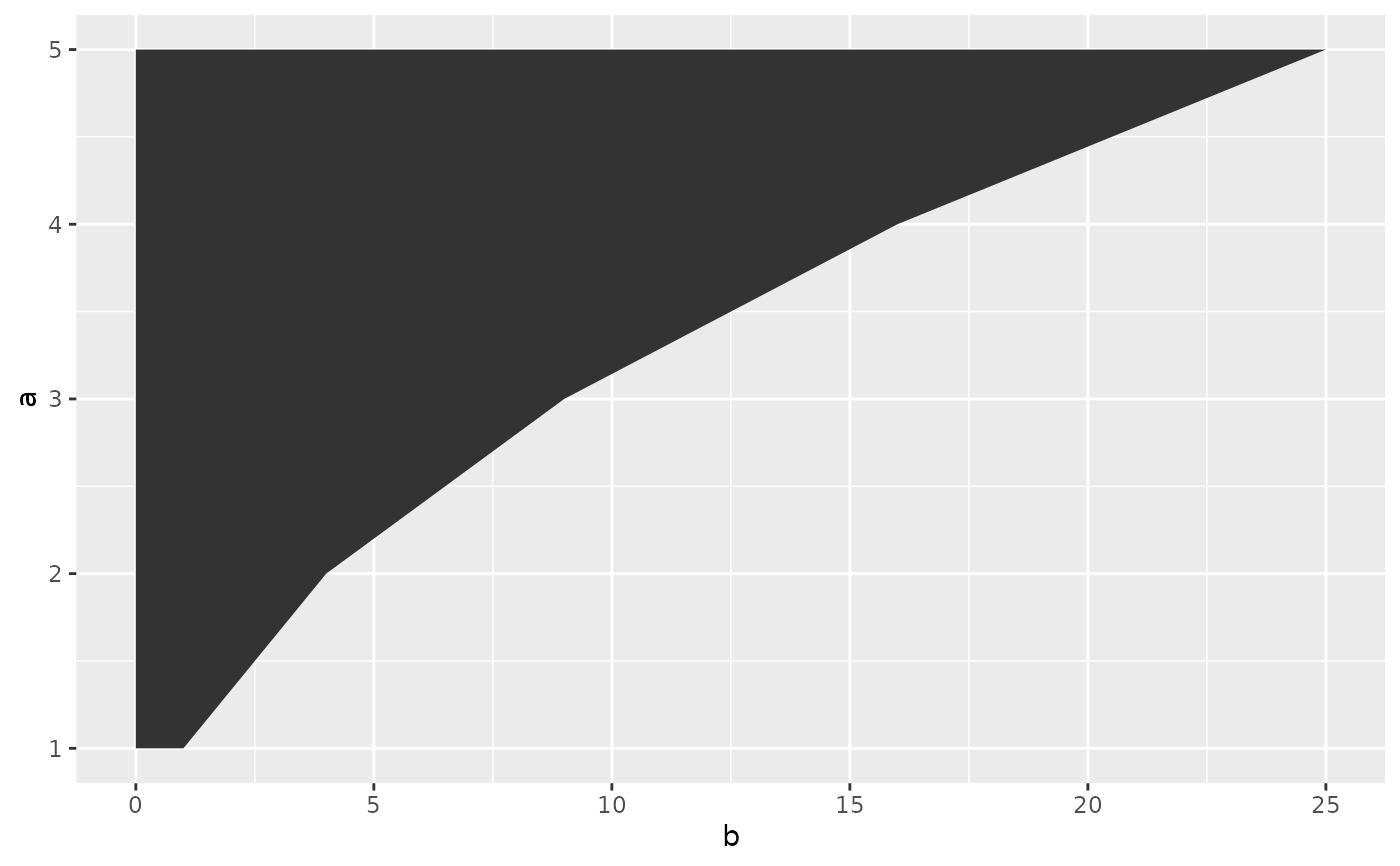
 # In line and area plots, swapped aesthetics require an explicit orientation
df <- data.frame(a = 1:5, b = (1:5) ^ 2)
ggplot(df, aes(b, a)) +
geom_area(orientation = "y")
# In line and area plots, swapped aesthetics require an explicit orientation
df <- data.frame(a = 1:5, b = (1:5) ^ 2)
ggplot(df, aes(b, a)) +
geom_area(orientation = "y")
 # The same plot with `coord_flip()`
ggplot(df, aes(a, b)) +
geom_area() +
coord_flip()
# The same plot with `coord_flip()`
ggplot(df, aes(a, b)) +
geom_area() +
coord_flip()
