These are complete themes which control all non-data display. Use
theme() if you just need to tweak the display of an existing
theme.
Usage
theme_grey(
  base_size = 11,
  base_family = "",
  header_family = NULL,
  base_line_size = base_size/22,
  base_rect_size = base_size/22,
  ink = "black",
  paper = "white",
  accent = "#3366FF"
)

theme_gray(
  base_size = 11,
  base_family = "",
  header_family = NULL,
  base_line_size = base_size/22,
  base_rect_size = base_size/22,
  ink = "black",
  paper = "white",
  accent = "#3366FF"
)

theme_bw(
  base_size = 11,
  base_family = "",
  header_family = NULL,
  base_line_size = base_size/22,
  base_rect_size = base_size/22,
  ink = "black",
  paper = "white",
  accent = "#3366FF"
)

theme_linedraw(
  base_size = 11,
  base_family = "",
  header_family = NULL,
  base_line_size = base_size/22,
  base_rect_size = base_size/22,
  ink = "black",
  paper = "white",
  accent = "#3366FF"
)

theme_light(
  base_size = 11,
  base_family = "",
  header_family = NULL,
  base_line_size = base_size/22,
  base_rect_size = base_size/22,
  ink = "black",
  paper = "white",
  accent = "#3366FF"
)

theme_dark(
  base_size = 11,
  base_family = "",
  header_family = NULL,
  base_line_size = base_size/22,
  base_rect_size = base_size/22,
  ink = "black",
  paper = "white",
  accent = "#3366FF"
)

theme_minimal(
  base_size = 11,
  base_family = "",
  header_family = NULL,
  base_line_size = base_size/22,
  base_rect_size = base_size/22,
  ink = "black",
  paper = "white",
  accent = "#3366FF"
)

theme_classic(
  base_size = 11,
  base_family = "",
  header_family = NULL,
  base_line_size = base_size/22,
  base_rect_size = base_size/22,
  ink = "black",
  paper = "white",
  accent = "#3366FF"
)

theme_void(
  base_size = 11,
  base_family = "",
  header_family = NULL,
  base_line_size = base_size/22,
  base_rect_size = base_size/22,
  ink = "black",
  paper = alpha(ink, 0),
  accent = "#3366FF"
)

theme_test(
  base_size = 11,
  base_family = "",
  header_family = NULL,
  base_line_size = base_size/22,
  base_rect_size = base_size/22,
  ink = "black",
  paper = "white",
  accent = "#3366FF"
)
Arguments
- base_size
base font size, given in pts.
- base_family
base font family
- header_family
font family for titles and headers. The default,
NULL, uses theme inheritance to set the font. This setting affects axis titles, legend titles, the plot title and tag text.- base_line_size
base size for line elements
- base_rect_size
base size for rect elements
- ink, paper, accent
colour for foreground, background, and accented elements respectively.
Details
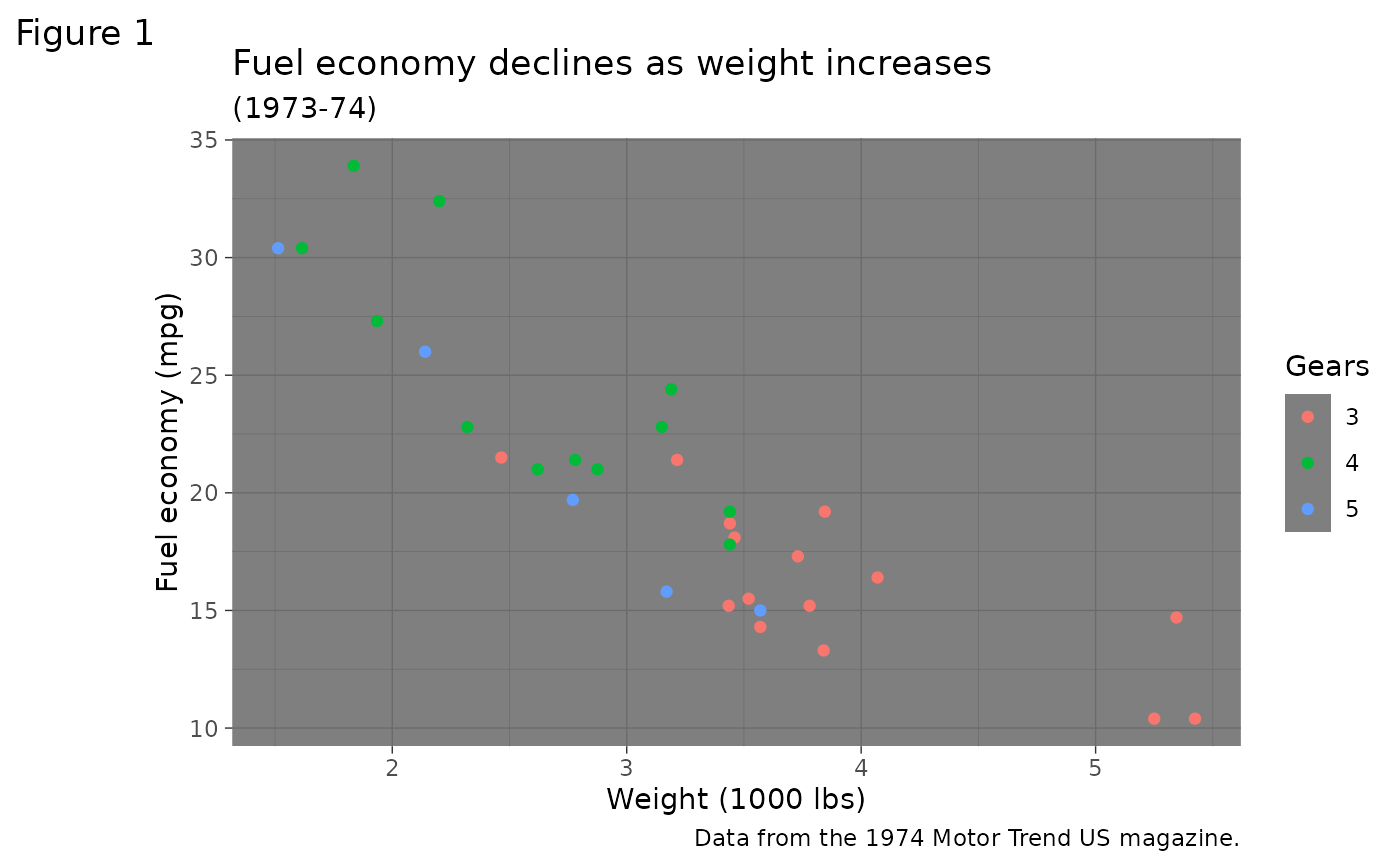
theme_gray()The signature ggplot2 theme with a grey background and white gridlines, designed to put the data forward yet make comparisons easy.
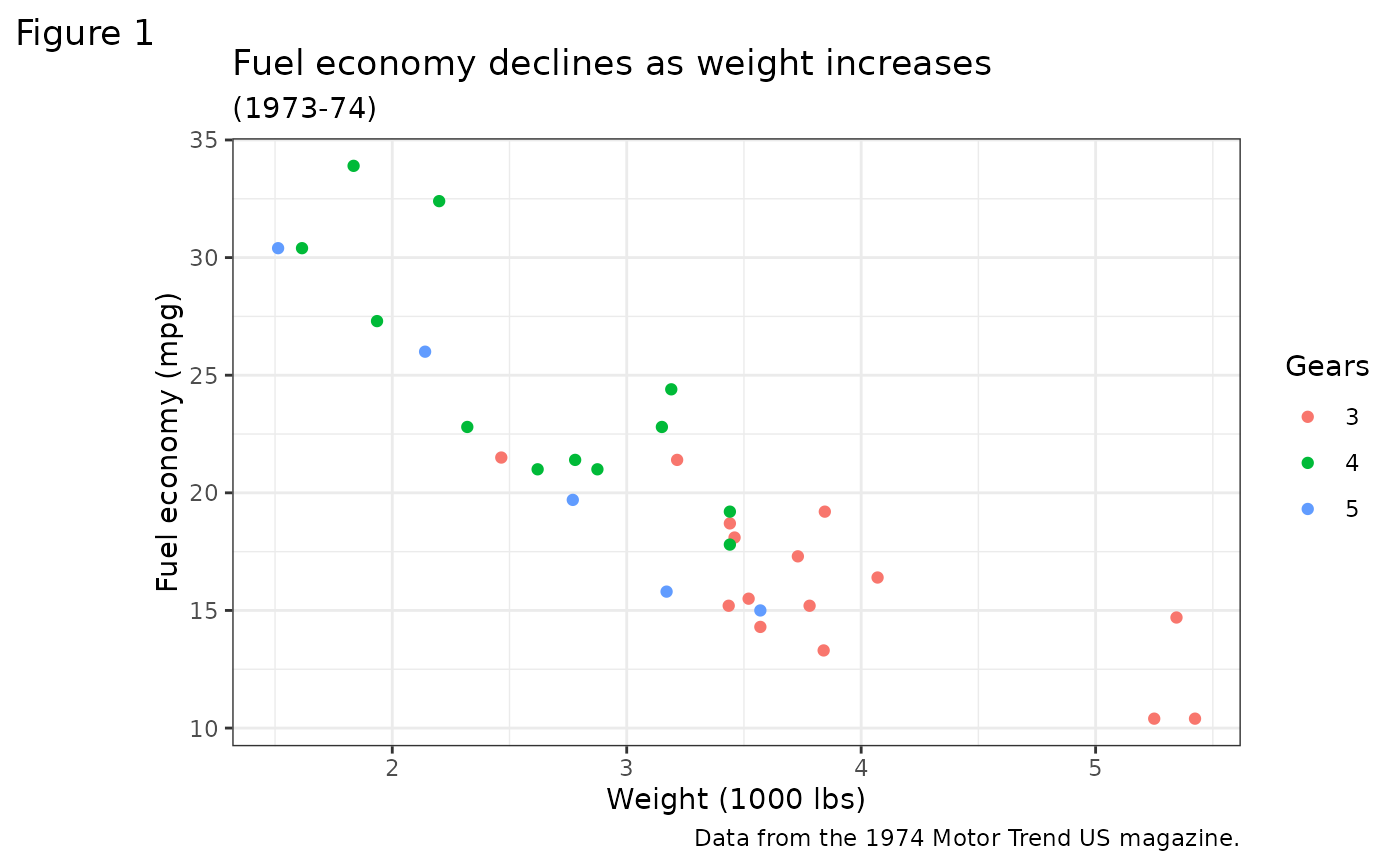
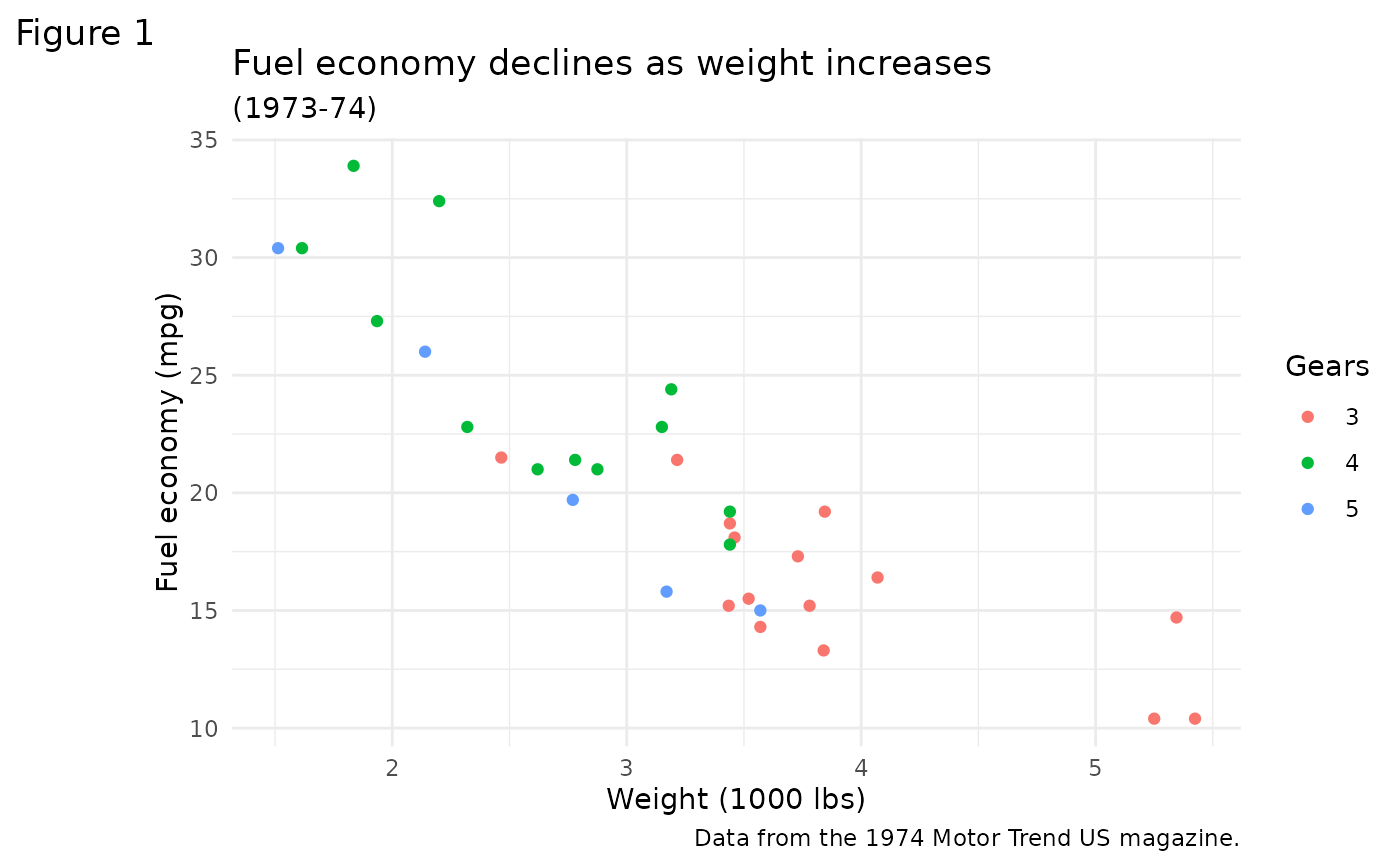
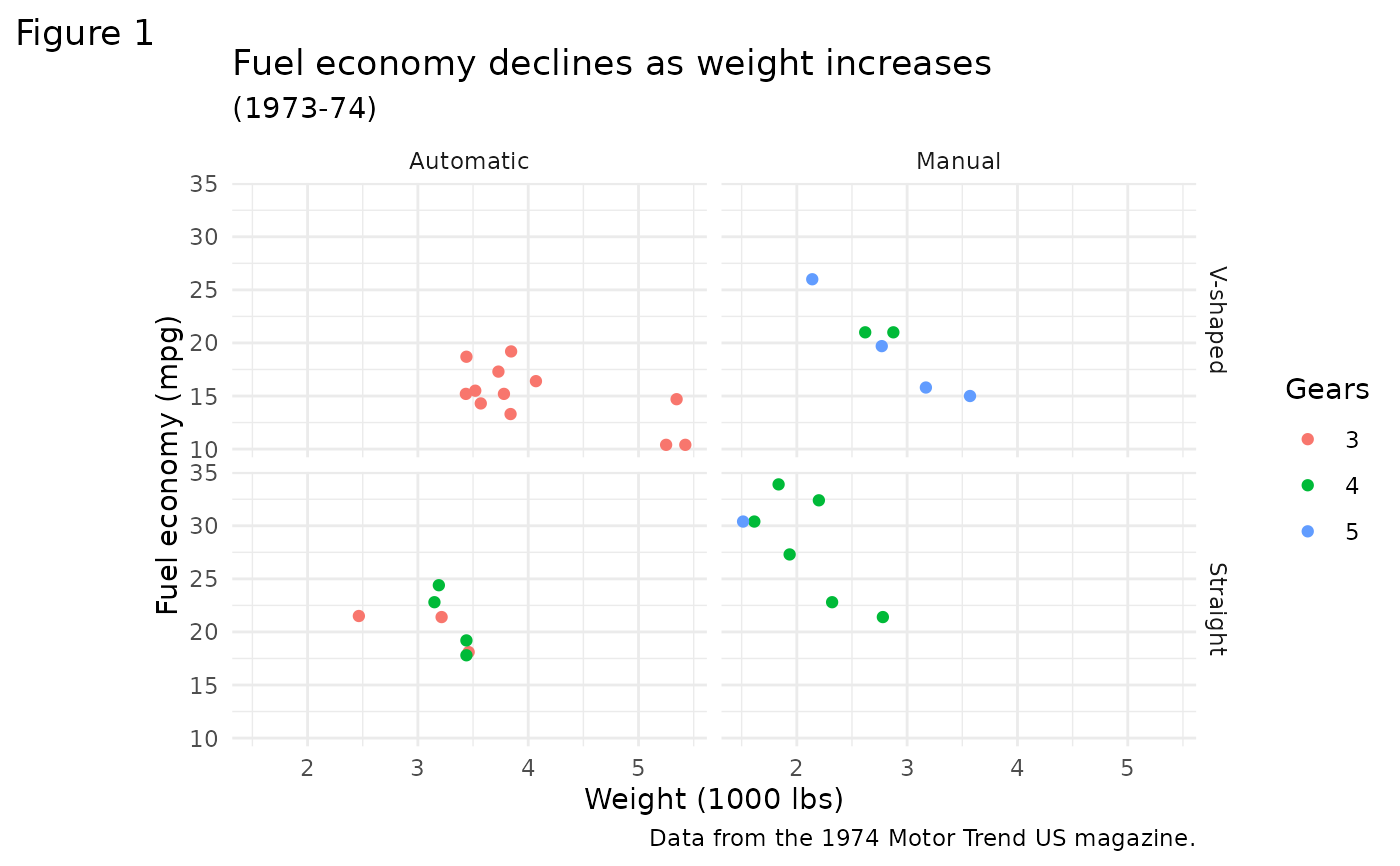
theme_bw()The classic dark-on-light ggplot2 theme. May work better for presentations displayed with a projector.
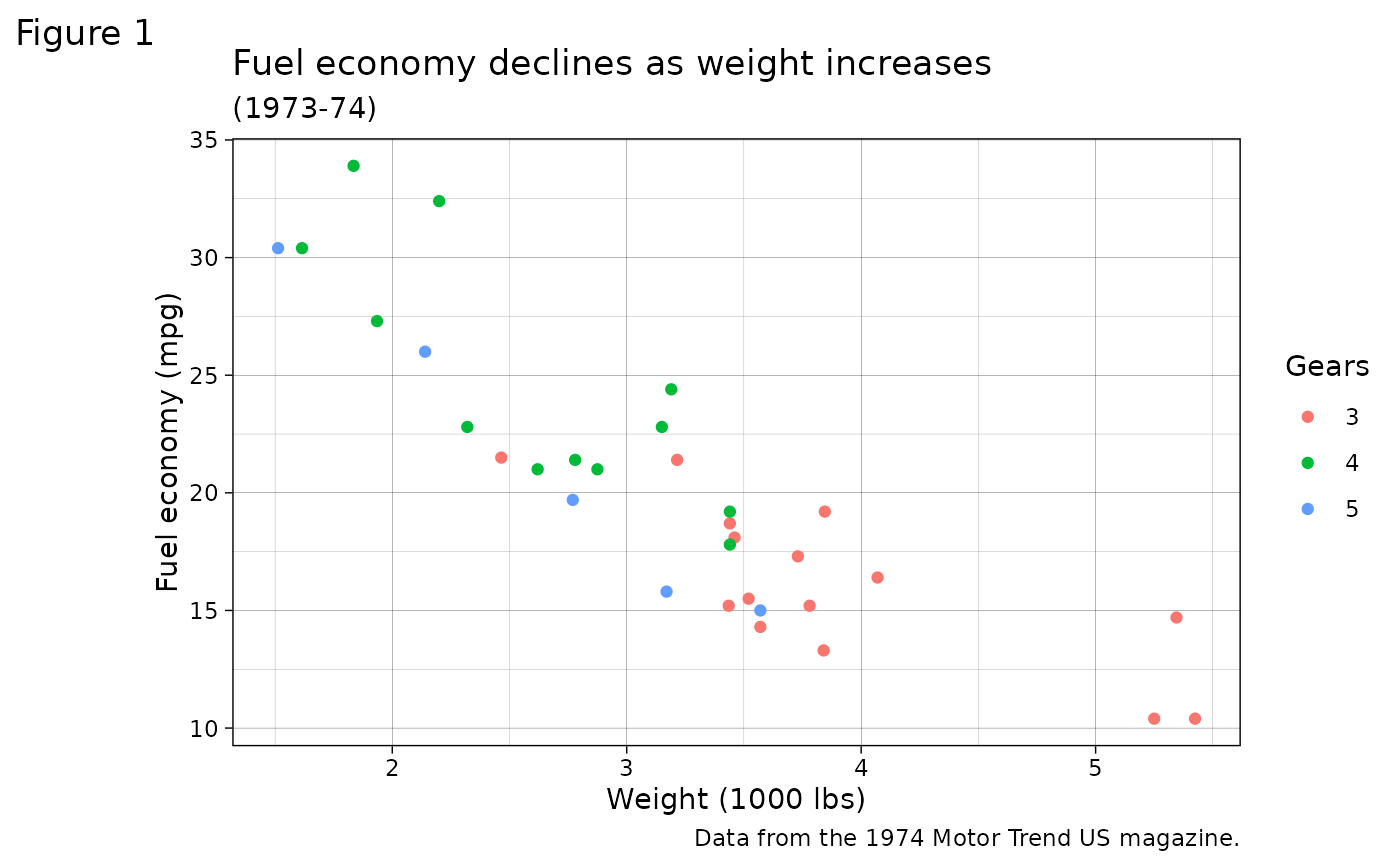
theme_linedraw()A theme with only black lines of various widths on white backgrounds, reminiscent of a line drawing. Serves a purpose similar to
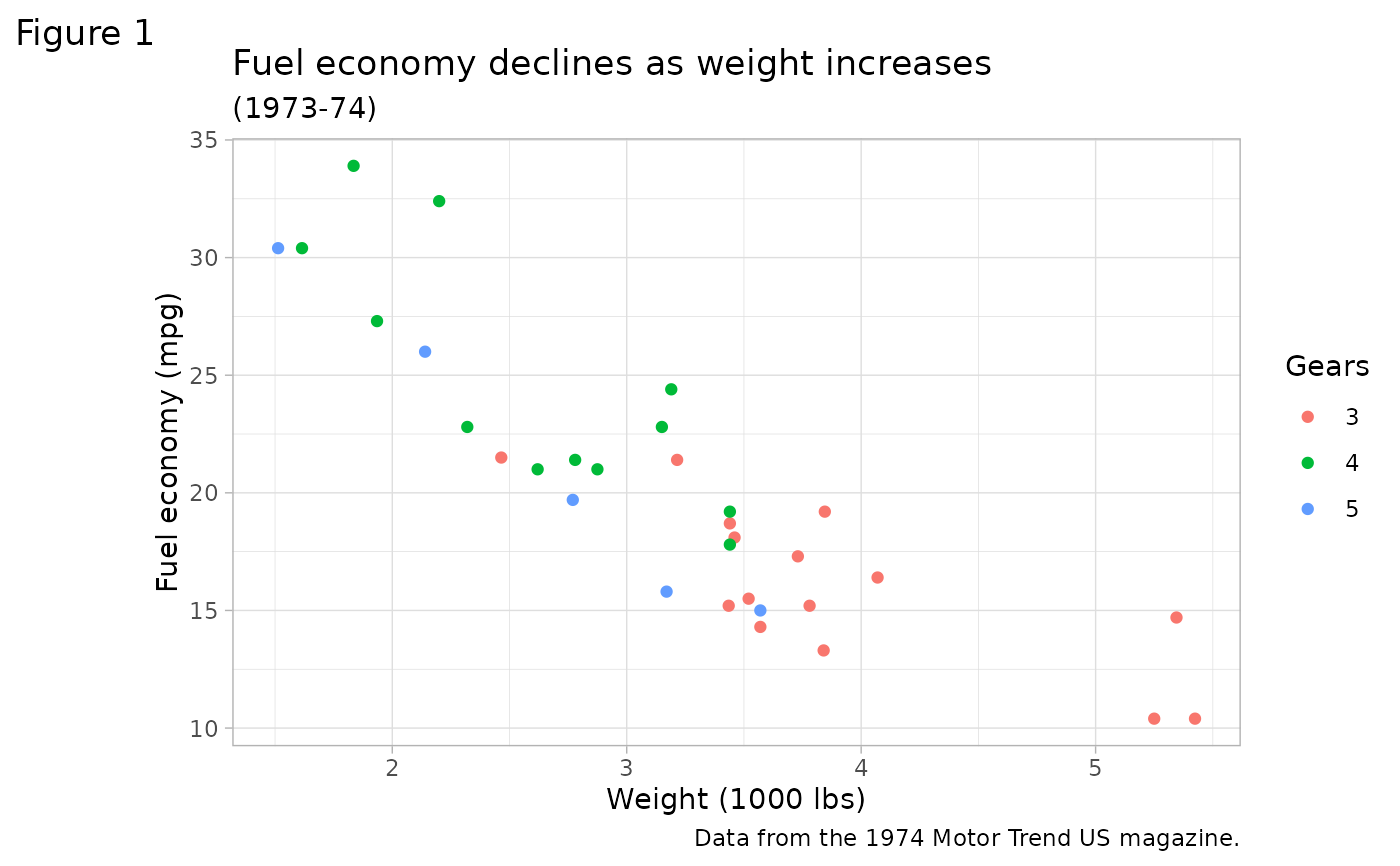
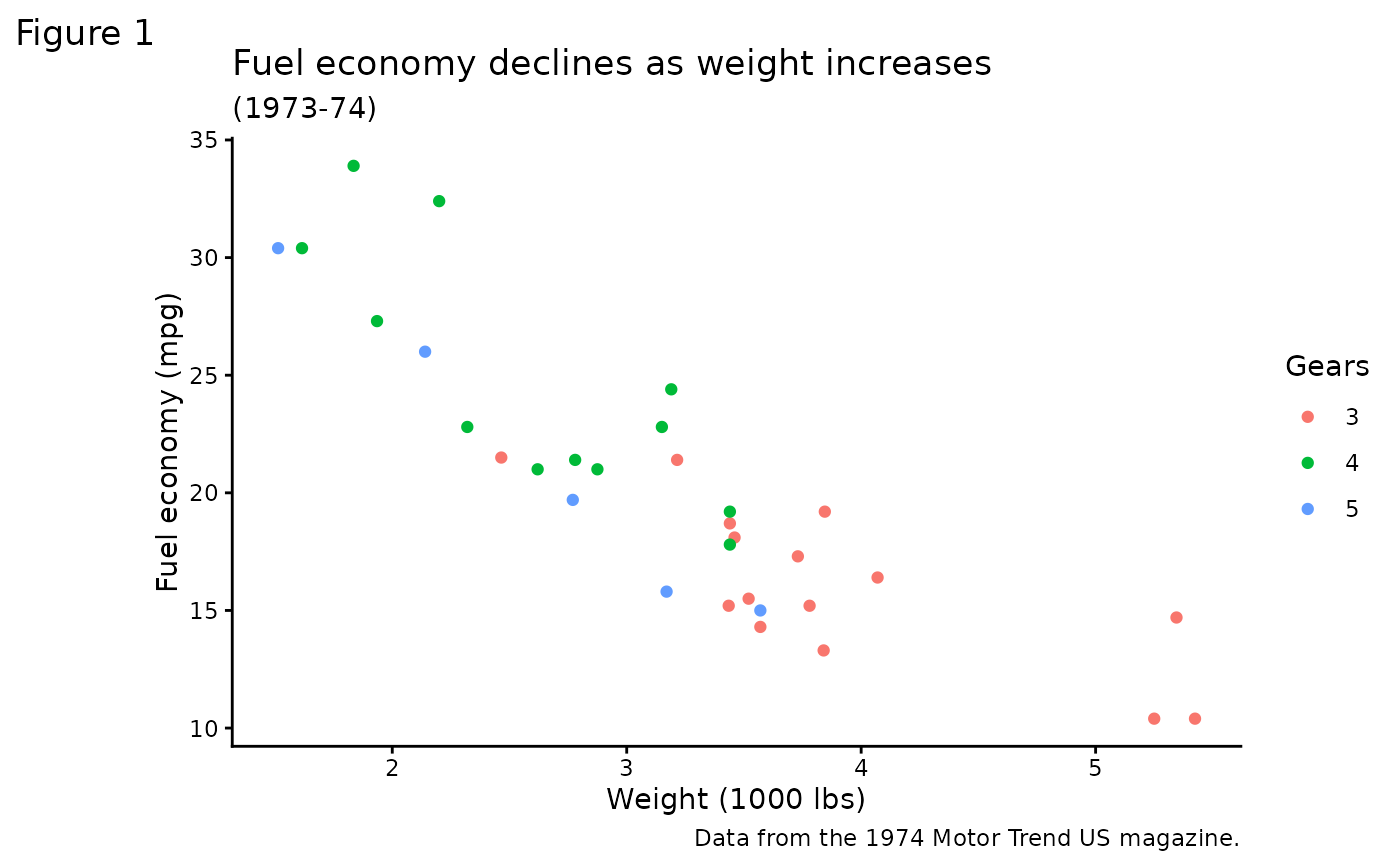
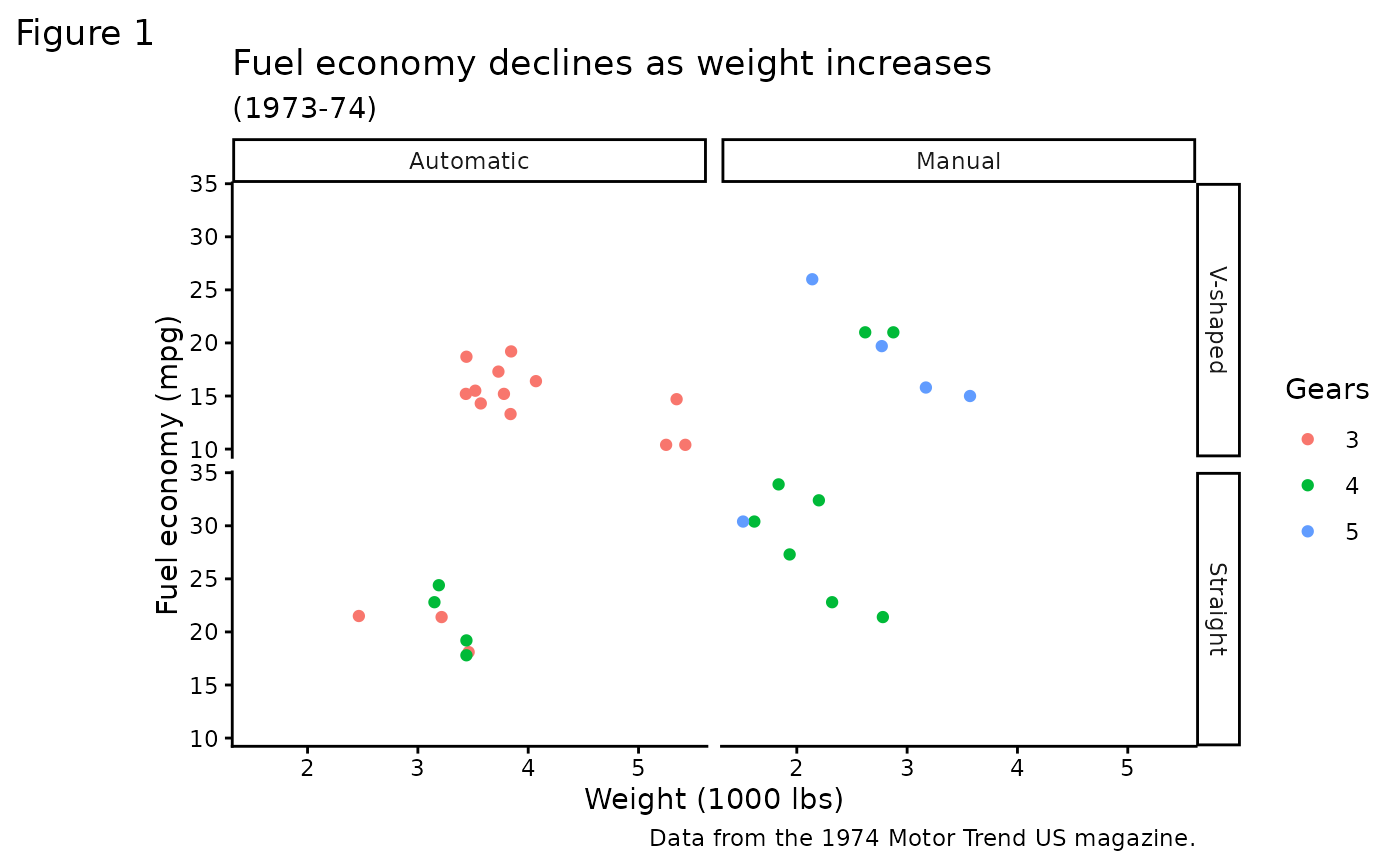
theme_bw(). Note that this theme has some very thin lines (<< 1 pt) which some journals may refuse.theme_light()A theme similar to
theme_linedraw()but with light grey lines and axes, to direct more attention towards the data.theme_dark()The dark cousin of
theme_light(), with similar line sizes but a dark background. Useful to make thin coloured lines pop out.theme_minimal()A minimalistic theme with no background annotations.
theme_classic()A classic-looking theme, with x and y axis lines and no gridlines.
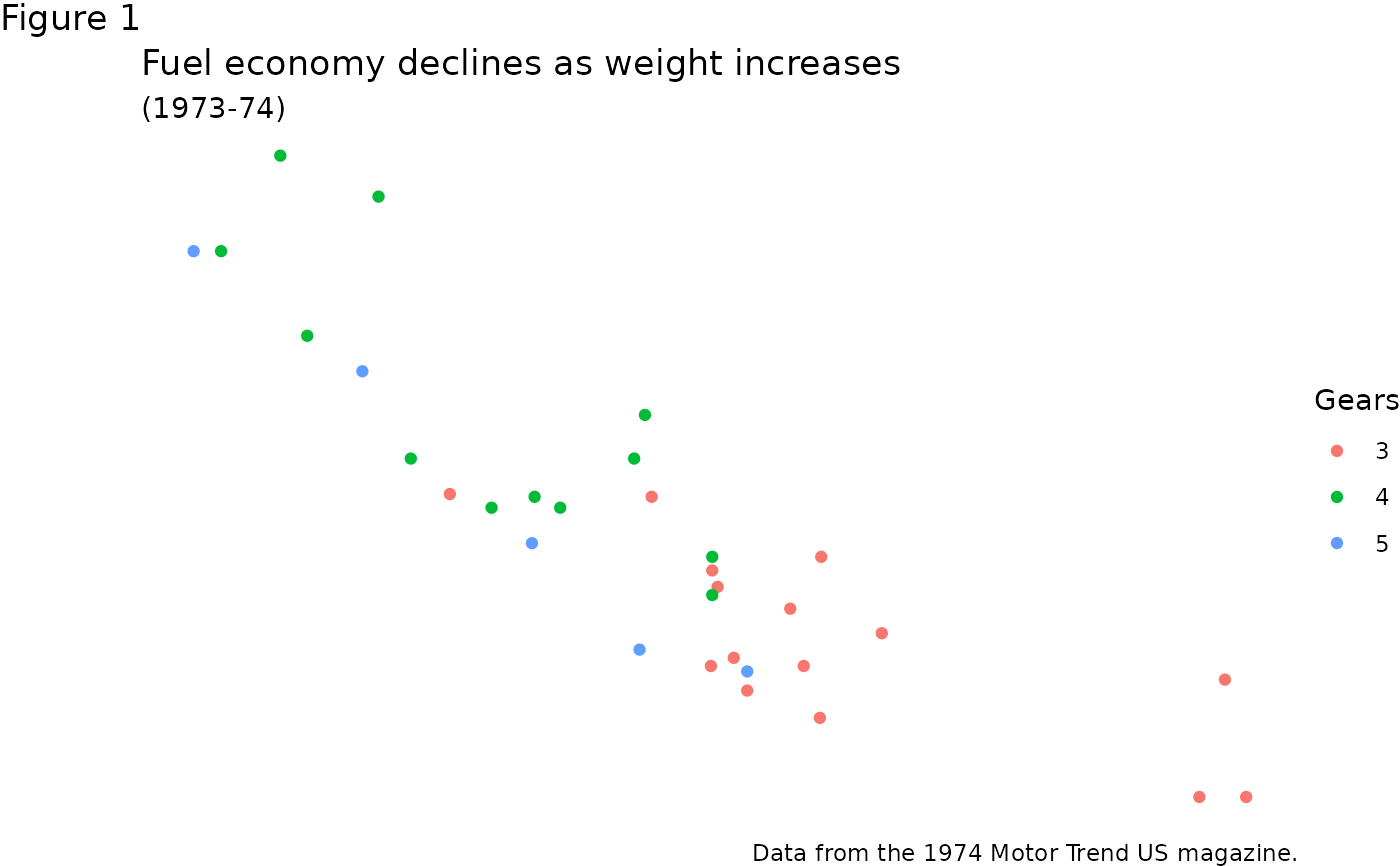
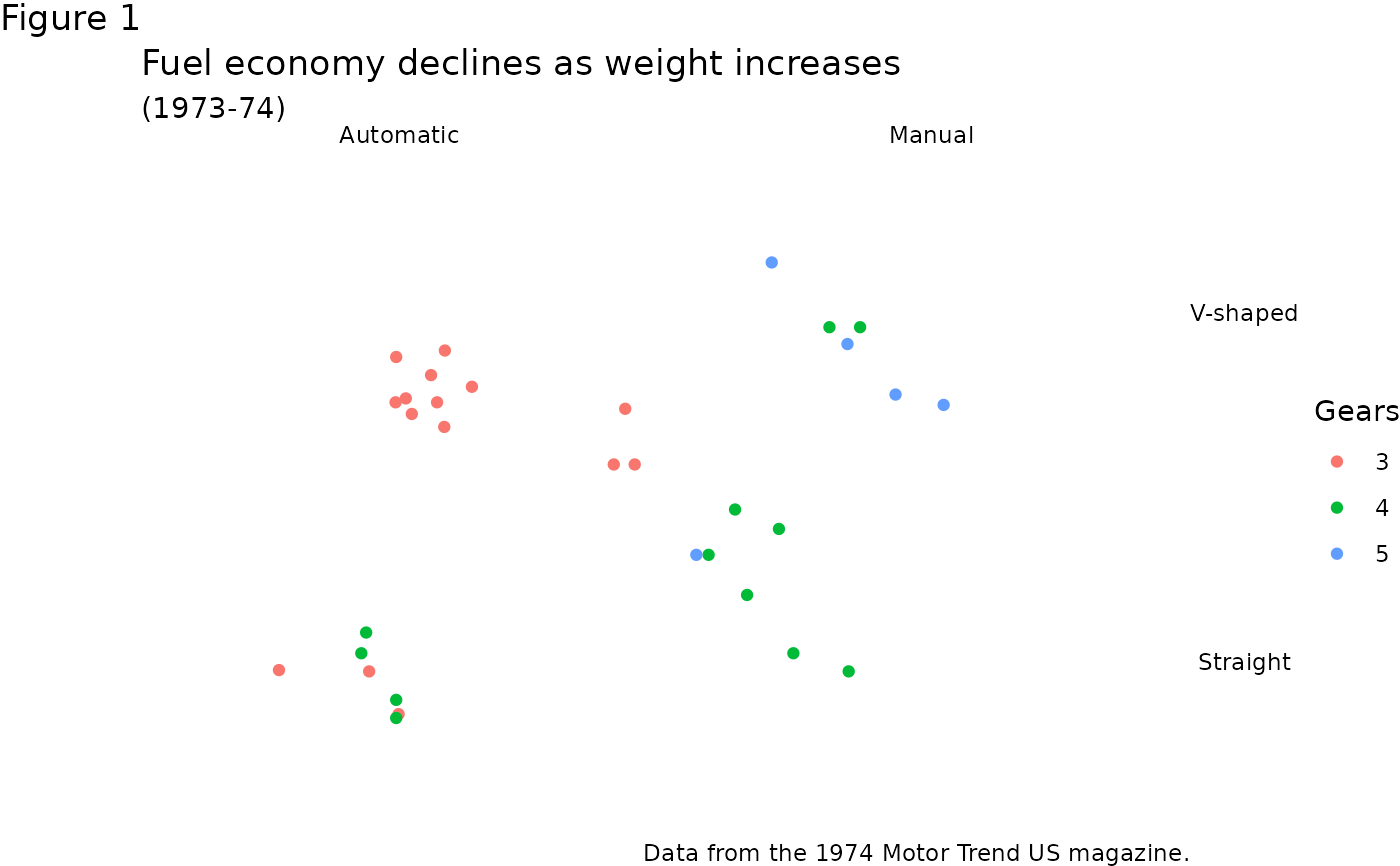
theme_void()A completely empty theme.
theme_test()A theme for visual unit tests. It should ideally never change except for new features.
See also
The complete themes section of the online ggplot2 book.
Examples
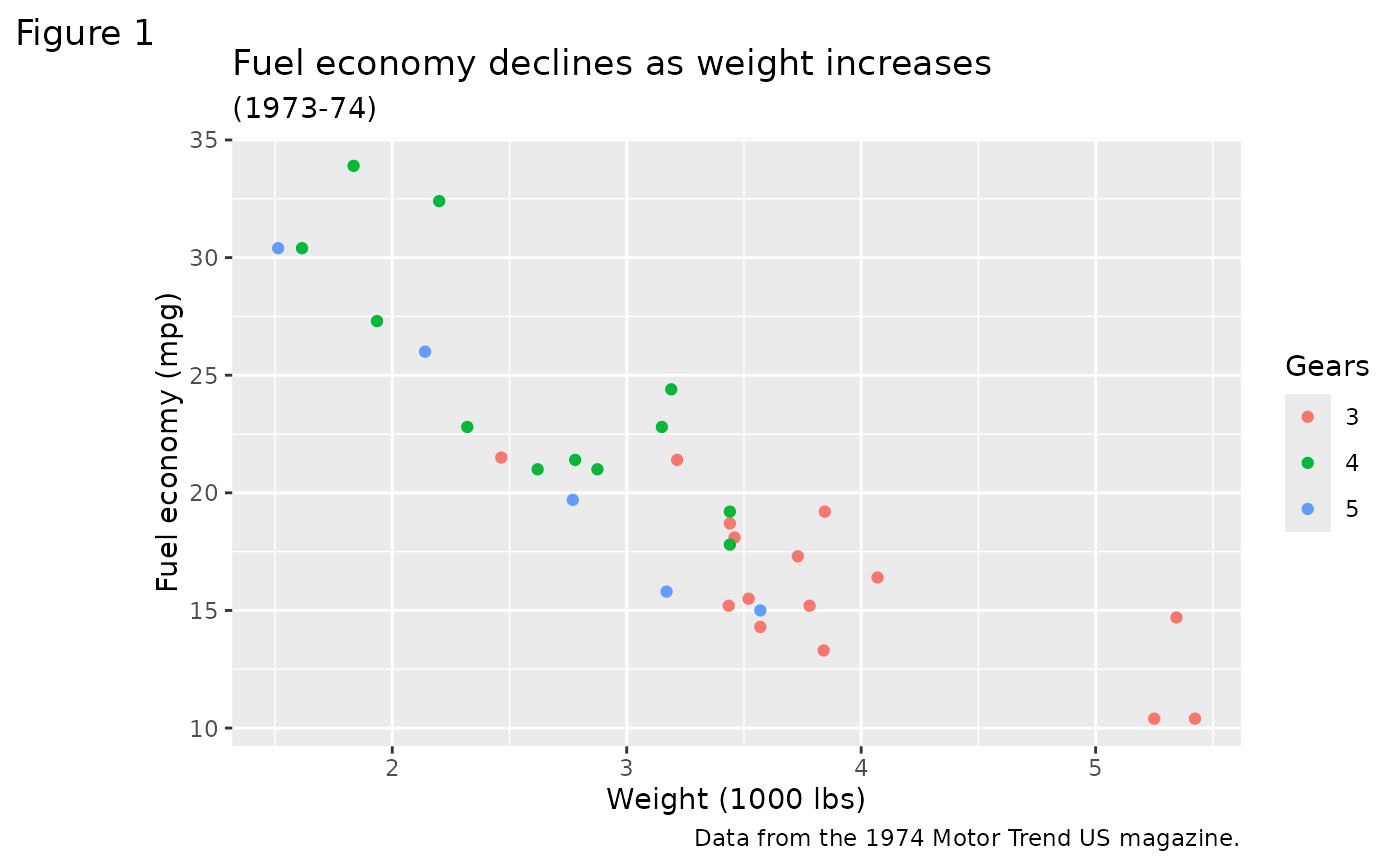
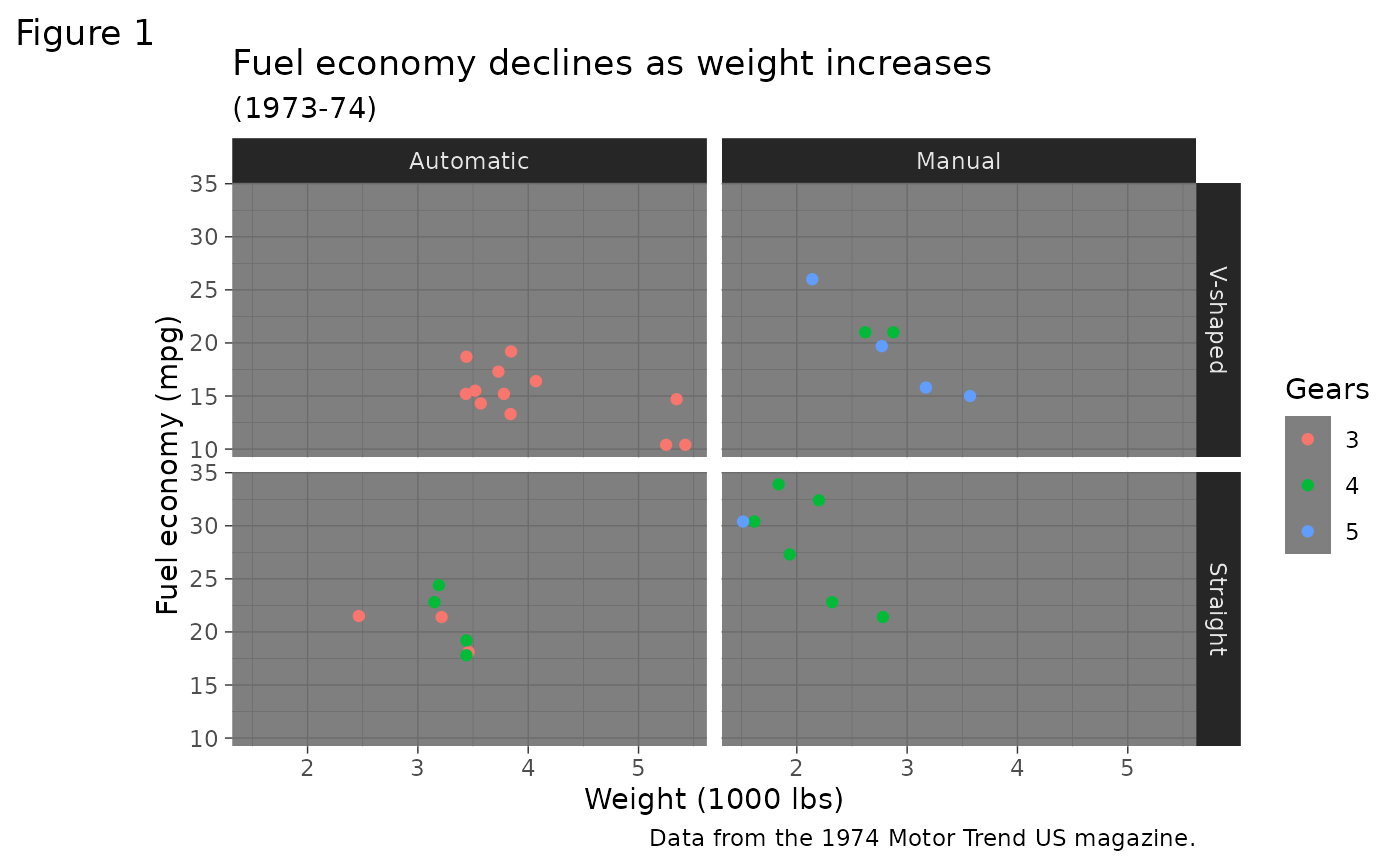
mtcars2 <- within(mtcars, {
vs <- factor(vs, labels = c("V-shaped", "Straight"))
am <- factor(am, labels = c("Automatic", "Manual"))
cyl <- factor(cyl)
gear <- factor(gear)
})
p1 <- ggplot(mtcars2) +
geom_point(aes(x = wt, y = mpg, colour = gear)) +
labs(
title = "Fuel economy declines as weight increases",
subtitle = "(1973-74)",
caption = "Data from the 1974 Motor Trend US magazine.",
tag = "Figure 1",
x = "Weight (1000 lbs)",
y = "Fuel economy (mpg)",
colour = "Gears"
)
p1 + theme_gray() # the default
 p1 + theme_bw()
 p1 + theme_linedraw()
 p1 + theme_light()
 p1 + theme_dark()
 p1 + theme_minimal()
 p1 + theme_classic()
 p1 + theme_void()
 # Theme examples with panels
# \donttest{
p2 <- p1 + facet_grid(vs ~ am)
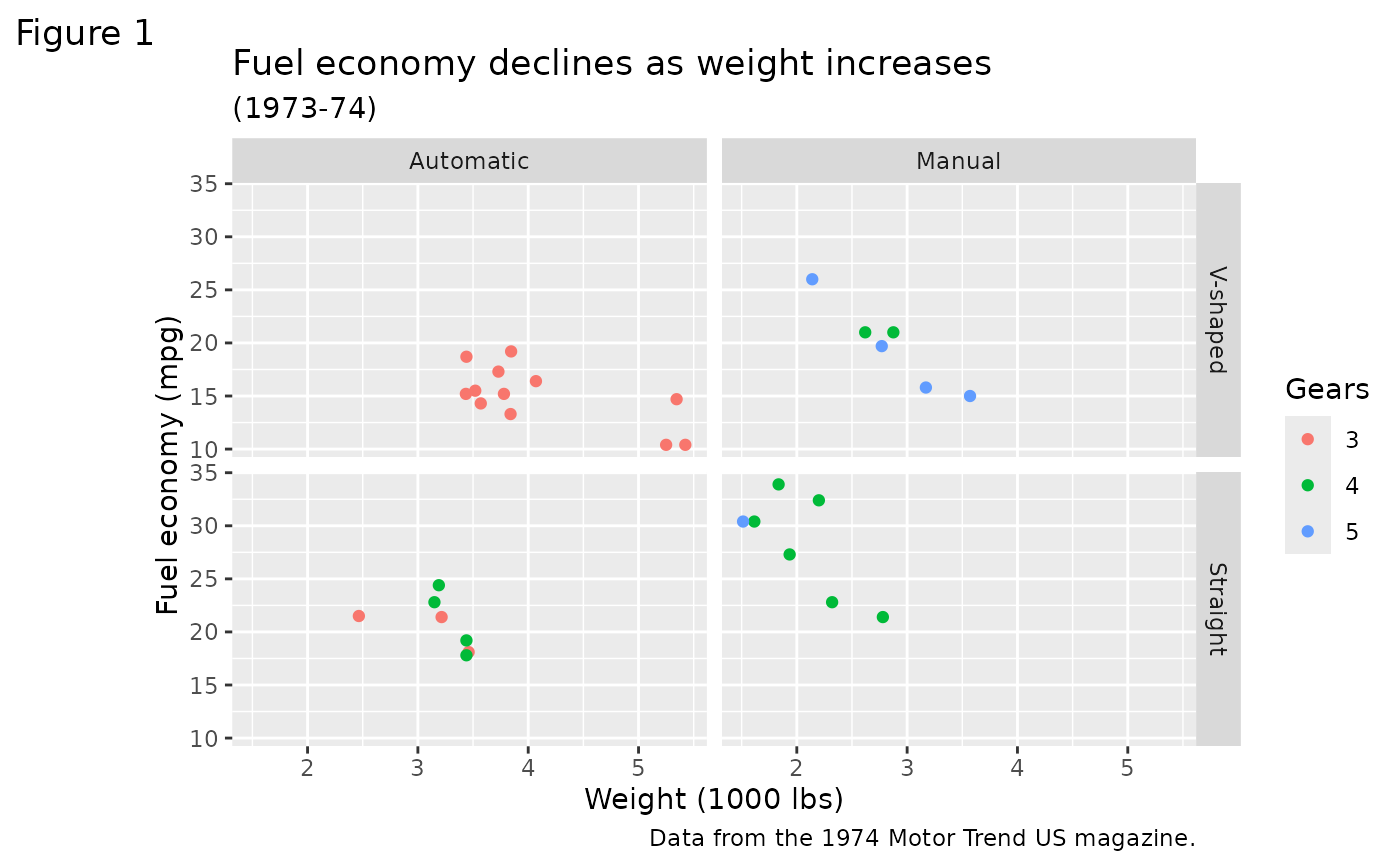
p2 + theme_gray() # the default
# Theme examples with panels
# \donttest{
p2 <- p1 + facet_grid(vs ~ am)
p2 + theme_gray() # the default
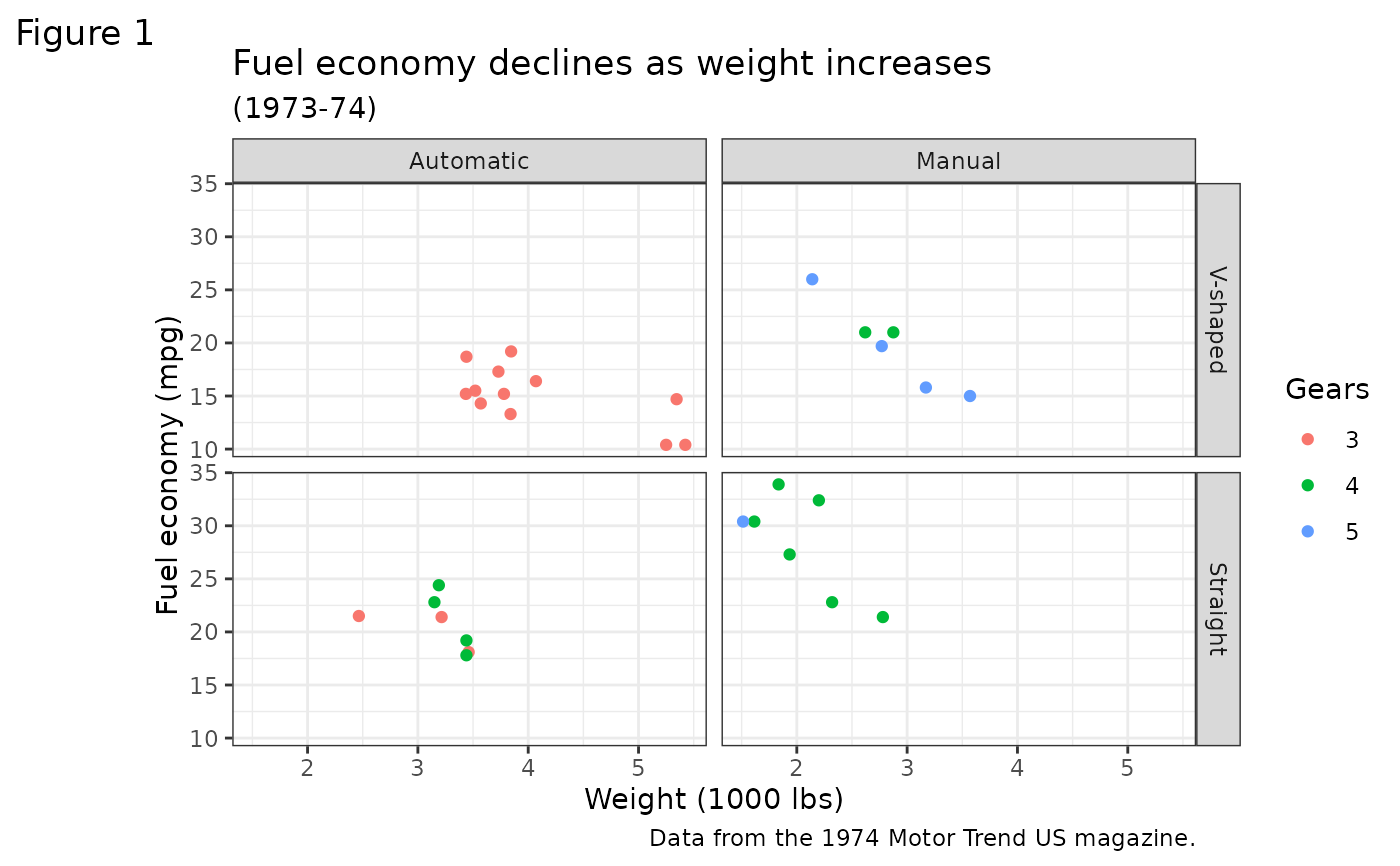
 p2 + theme_bw()
 p2 + theme_linedraw()
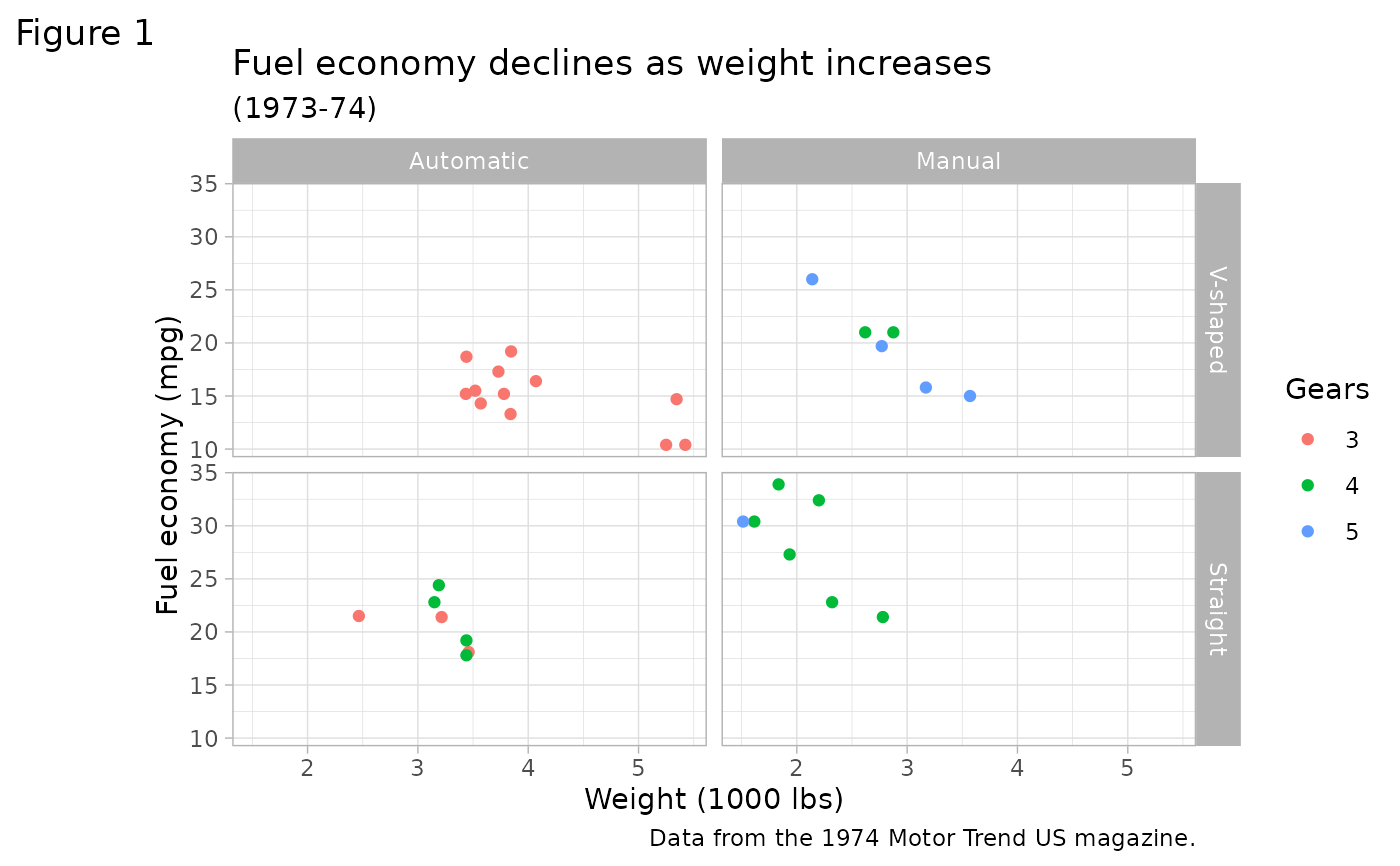
 p2 + theme_light()
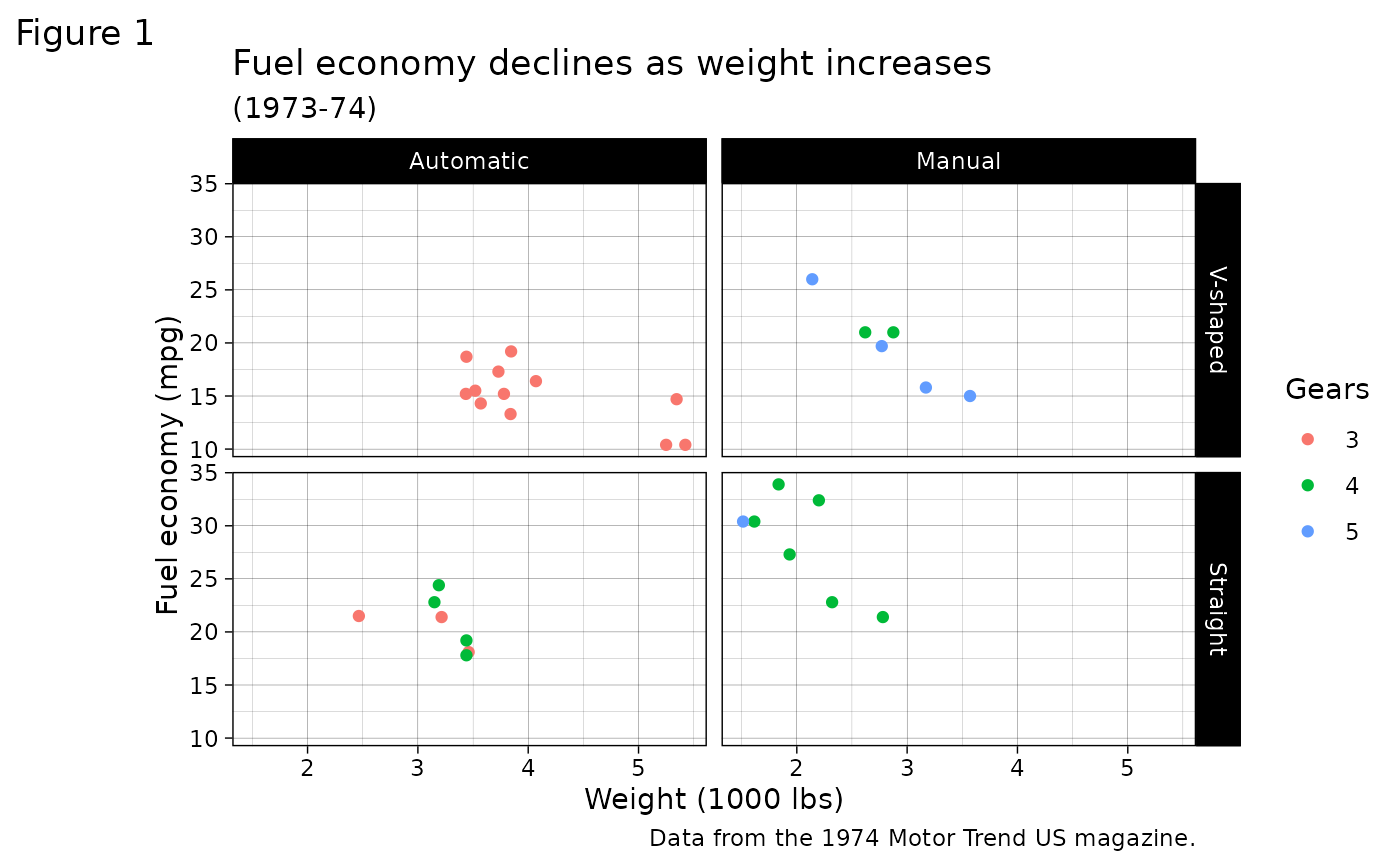
 p2 + theme_dark()
 p2 + theme_minimal()
 p2 + theme_classic()
 p2 + theme_void()
 # }
# }