This function is deprecated because using broom::tidy() is a better
solution to convert model objects.
Arguments
- model
an object of class
glht,confint.glht,summary.glhtormultcomp::cld()- data, ...
other arguments to the generic ignored in this method.
Examples
amod <- aov(breaks ~ wool + tension, data = warpbreaks)
wht <- multcomp::glht(amod, linfct = multcomp::mcp(tension = "Tukey"))

tidy(wht) # recommended
#> # A tibble: 3 × 7
#>   term    contrast null.value estimate std.error statistic adj.p.value
#>   <chr>   <chr>         <dbl>    <dbl>     <dbl>     <dbl>       <dbl>
#> 1 tension M - L             0   -10.0       3.87     -2.58     0.0336
#> 2 tension H - L             0   -14.7       3.87     -3.80     0.00110
#> 3 tension H - M             0    -4.72      3.87     -1.22     0.447
fortify(wht)
#> Warning: `fortify(<glht>)` was deprecated in ggplot2 4.0.0.
#> ℹ Please use `broom::tidy(<glht>)` instead.
#>            lhs rhs   estimate
#> tension1 M - L   0 -10.000000
#> tension2 H - L   0 -14.722222
#> tension3 H - M   0  -4.722222

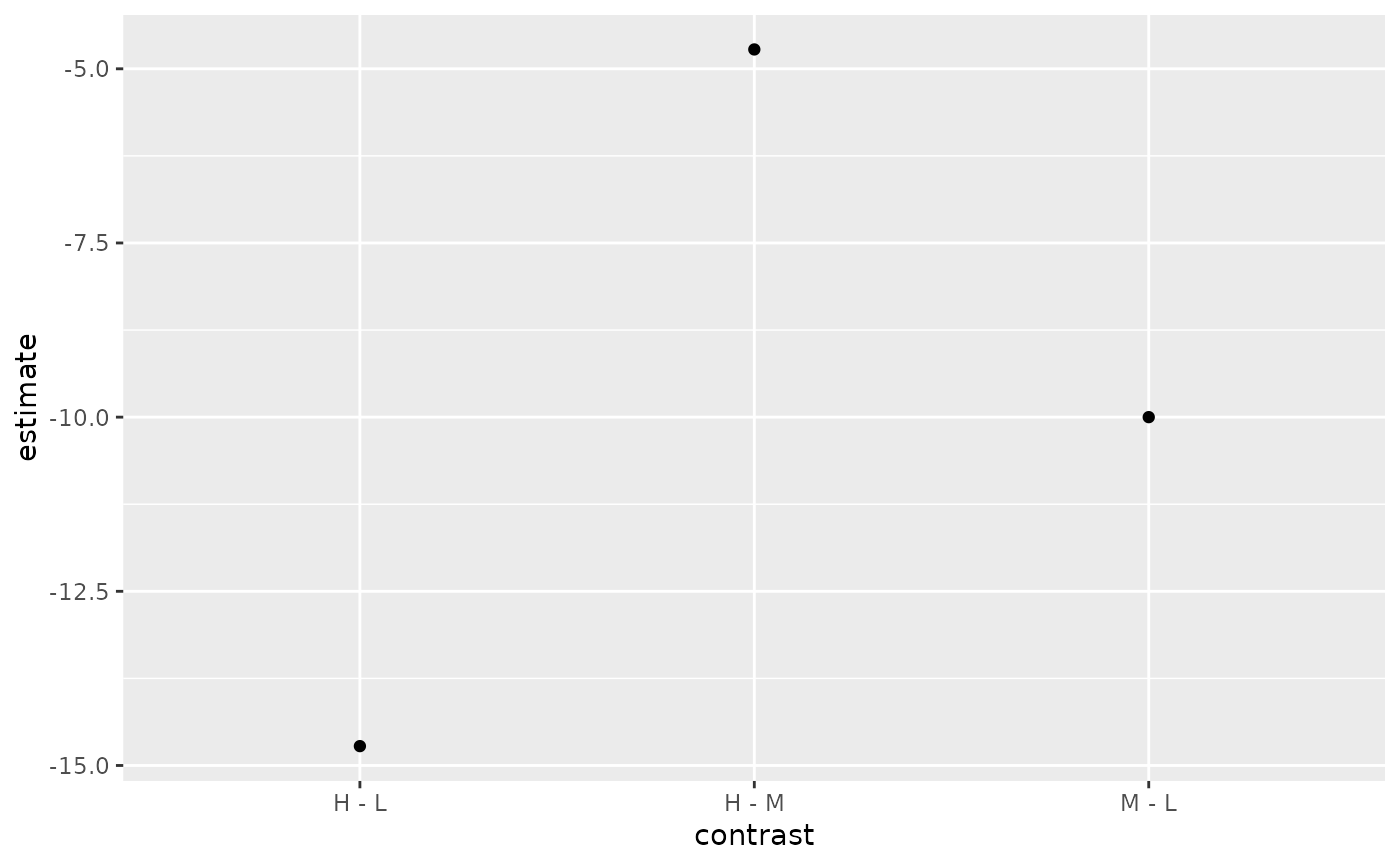
ggplot(tidy(wht), aes(contrast, estimate)) + geom_point()


ci <- confint(wht)
tidy(ci) # recommended
#> # A tibble: 3 × 5
#>   term    contrast estimate conf.low conf.high
#>   <chr>   <chr>       <dbl>    <dbl>     <dbl>
#> 1 tension M - L      -10.0     -19.4    -0.645
#> 2 tension H - L      -14.7     -24.1    -5.37
#> 3 tension H - M       -4.72    -14.1     4.63
fortify(ci)
#> Warning: `fortify(<confint.glht>)` was deprecated in ggplot2 4.0.0.
#> ℹ Please use `broom::tidy(<confint.glht>)` instead.
#>         lhs rhs   estimate       lwr        upr
#> M - L M - L   0 -10.000000 -19.35506 -0.6449368
#> H - L H - L   0 -14.722222 -24.07729 -5.3671590
#> H - M H - M   0  -4.722222 -14.07729  4.6328410

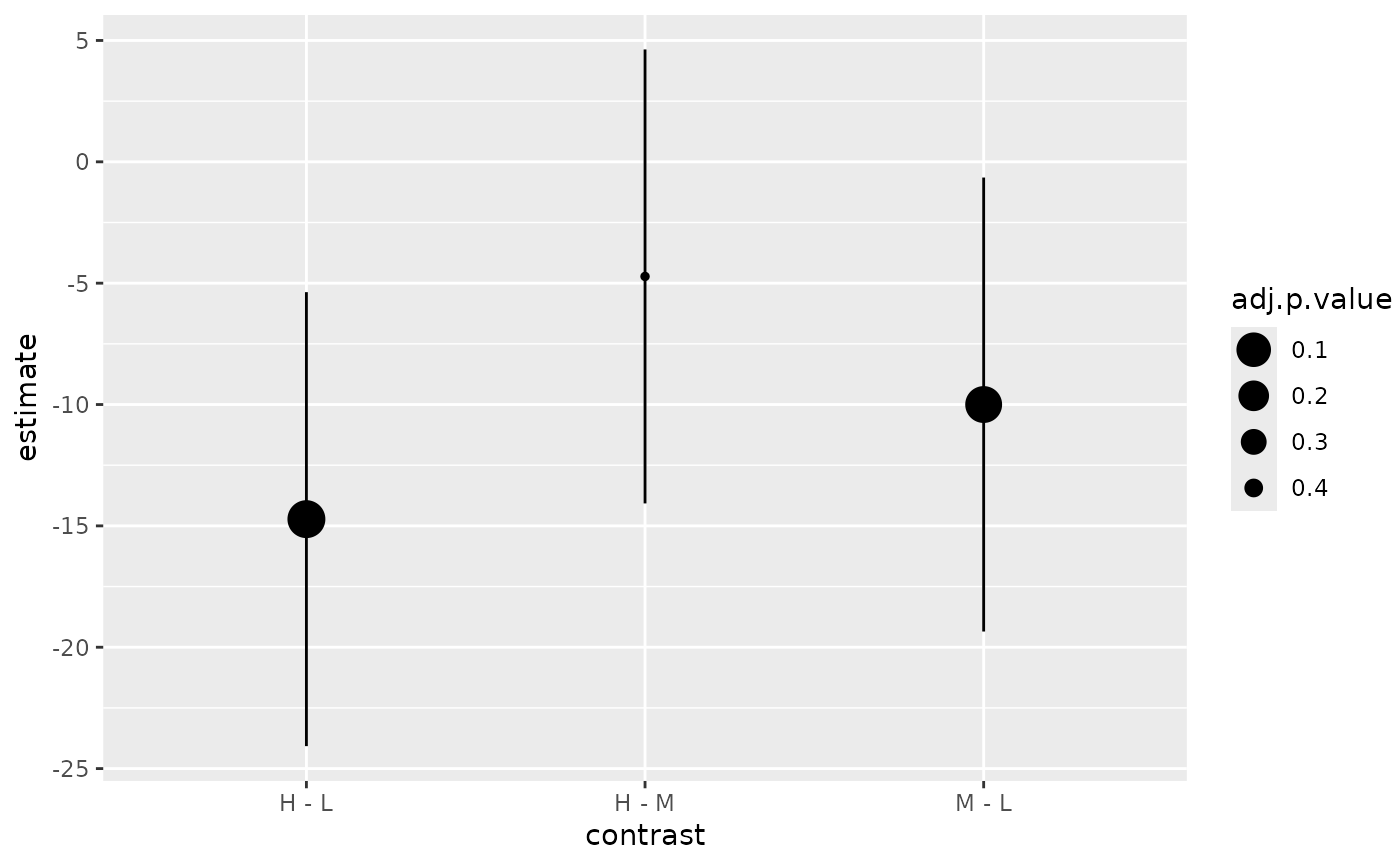
ggplot(tidy(confint(wht)),
       aes(contrast, estimate, ymin = conf.low, ymax = conf.high)) +
   geom_pointrange()


smry <- summary(wht)
tidy(smry) # recommended
#> # A tibble: 3 × 7
#>   term    contrast null.value estimate std.error statistic adj.p.value
#>   <chr>   <chr>         <dbl>    <dbl>     <dbl>     <dbl>       <dbl>
#> 1 tension M - L             0   -10.0       3.87     -2.58     0.0337
#> 2 tension H - L             0   -14.7       3.87     -3.80     0.00113
#> 3 tension H - M             0    -4.72      3.87     -1.22     0.447
fortify(smry)
#> Warning: `fortify(<summary.glht>)` was deprecated in ggplot2 4.0.0.
#> ℹ Please use `broom::tidy(<summary.glht>)` instead.
#>         lhs rhs   estimate       se         t           p
#> M - L M - L   0 -10.000000 3.872378 -2.582393 0.033655435
#> H - L H - L   0 -14.722222 3.872378 -3.801856 0.001128998
#> H - M H - M   0  -4.722222 3.872378 -1.219463 0.447434894

ggplot(mapping = aes(contrast, estimate)) +
   geom_linerange(aes(ymin = conf.low, ymax = conf.high), data = tidy(ci)) +
   geom_point(aes(size = adj.p.value), data = tidy(smry)) +
   scale_size(transform = "reverse")


cld <- multcomp::cld(wht)
tidy(cld) # recommended
#> # A tibble: 3 × 2
#>   tension letters
#>   <chr>   <chr>
#> 1 L       a
#> 2 M       b
#> 3 H       b
fortify(cld)
#>   lhs letters
#> L   L       a
#> M   M       b
#> H   H       b
