This function adds geoms to a plot, but unlike a typical geom function, the properties of the geoms are not mapped from variables of a data frame, but are instead passed in as vectors. This is useful for adding small annotations (such as text labels) or if you have your data in vectors, and for some reason don't want to put them in a data frame.
Usage
annotate(
  geom,
  x = NULL,
  y = NULL,
  xmin = NULL,
  xmax = NULL,
  ymin = NULL,
  ymax = NULL,
  xend = NULL,
  yend = NULL,
  ...,
  na.rm = FALSE
)
Arguments
- geom
name of geom to use for annotation
- x, y, xmin, ymin, xmax, ymax, xend, yend
positioning aesthetics - you must specify at least one of these.
- ...
Other arguments passed on to
layer()'sparamsargument. These arguments broadly fall into one of 4 categories below. Notably, further arguments to thepositionargument, or aesthetics that are required can not be passed through.... Unknown arguments that are not part of the 4 categories below are ignored.Static aesthetics that are not mapped to a scale, but are at a fixed value and apply to the layer as a whole. For example,
colour = "red"orlinewidth = 3. The geom's documentation has an Aesthetics section that lists the available options. The 'required' aesthetics cannot be passed on to theparams. Please note that while passing unmapped aesthetics as vectors is technically possible, the order and required length is not guaranteed to be parallel to the input data.When constructing a layer using a
stat_*()function, the...argument can be used to pass on parameters to thegeompart of the layer. An example of this isstat_density(geom = "area", outline.type = "both"). The geom's documentation lists which parameters it can accept.Inversely, when constructing a layer using a
geom_*()function, the...argument can be used to pass on parameters to thestatpart of the layer. An example of this isgeom_area(stat = "density", adjust = 0.5). The stat's documentation lists which parameters it can accept.The
key_glyphargument oflayer()may also be passed on through.... This can be one of the functions described as key glyphs, to change the display of the layer in the legend.
- na.rm
If
FALSE, the default, missing values are removed with a warning. IfTRUE, missing values are silently removed.
Details
Note that all position aesthetics are scaled (i.e. they will expand the limits of the plot so they are visible), but all other aesthetics are set. This means that layers created with this function will never affect the legend.
Unsupported geoms
Due to their special nature, reference line geoms geom_abline(),
geom_hline(), and geom_vline() can't be used with annotate().
You can use these geoms directly for annotations.
See also
The custom annotations section of the online ggplot2 book.
Examples
p <- ggplot(mtcars, aes(x = wt, y = mpg)) + geom_point()
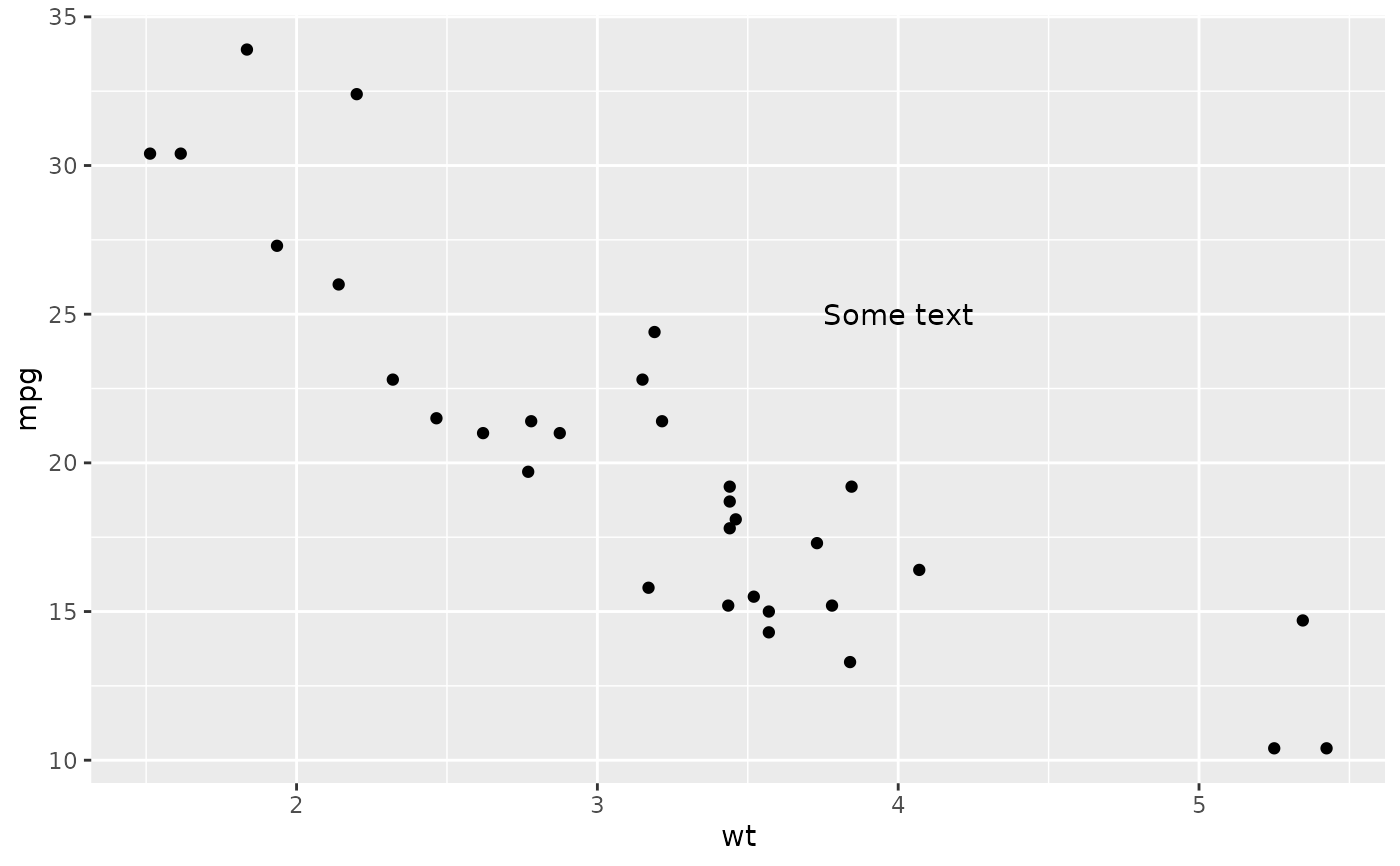
p + annotate("text", x = 4, y = 25, label = "Some text")
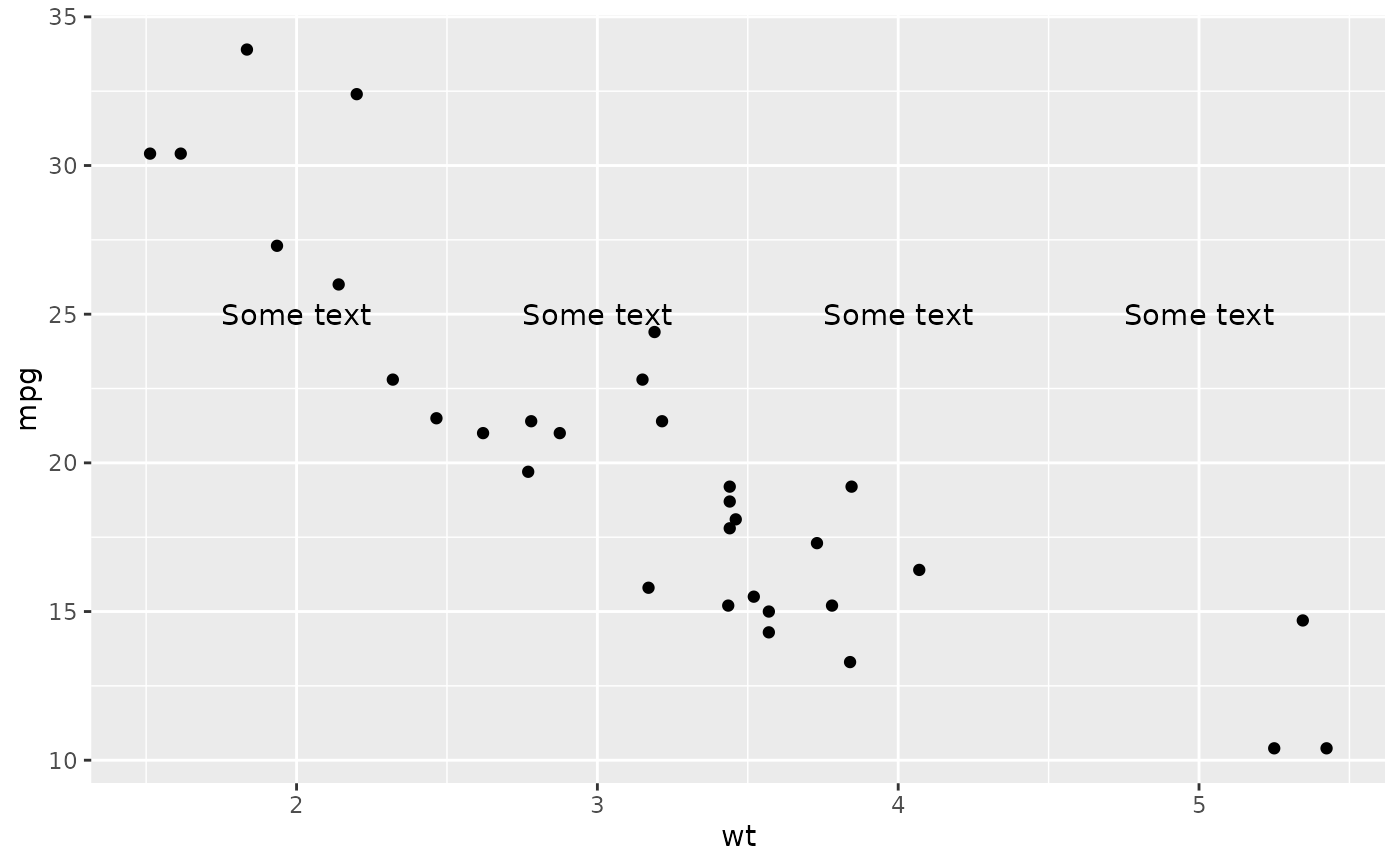
 p + annotate("text", x = 2:5, y = 25, label = "Some text")
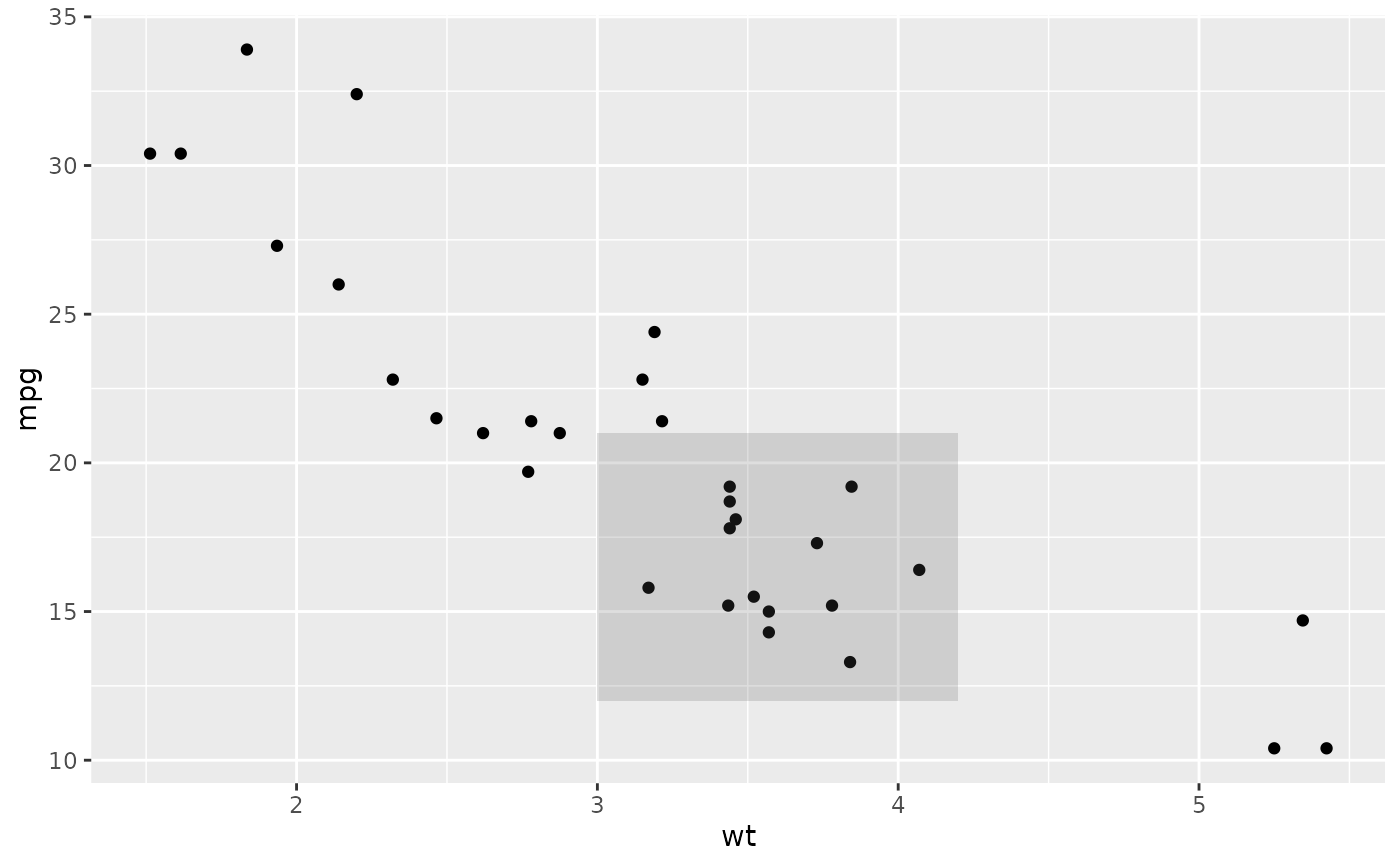
 p + annotate("rect", xmin = 3, xmax = 4.2, ymin = 12, ymax = 21,
alpha = .2)
p + annotate("rect", xmin = 3, xmax = 4.2, ymin = 12, ymax = 21,
alpha = .2)
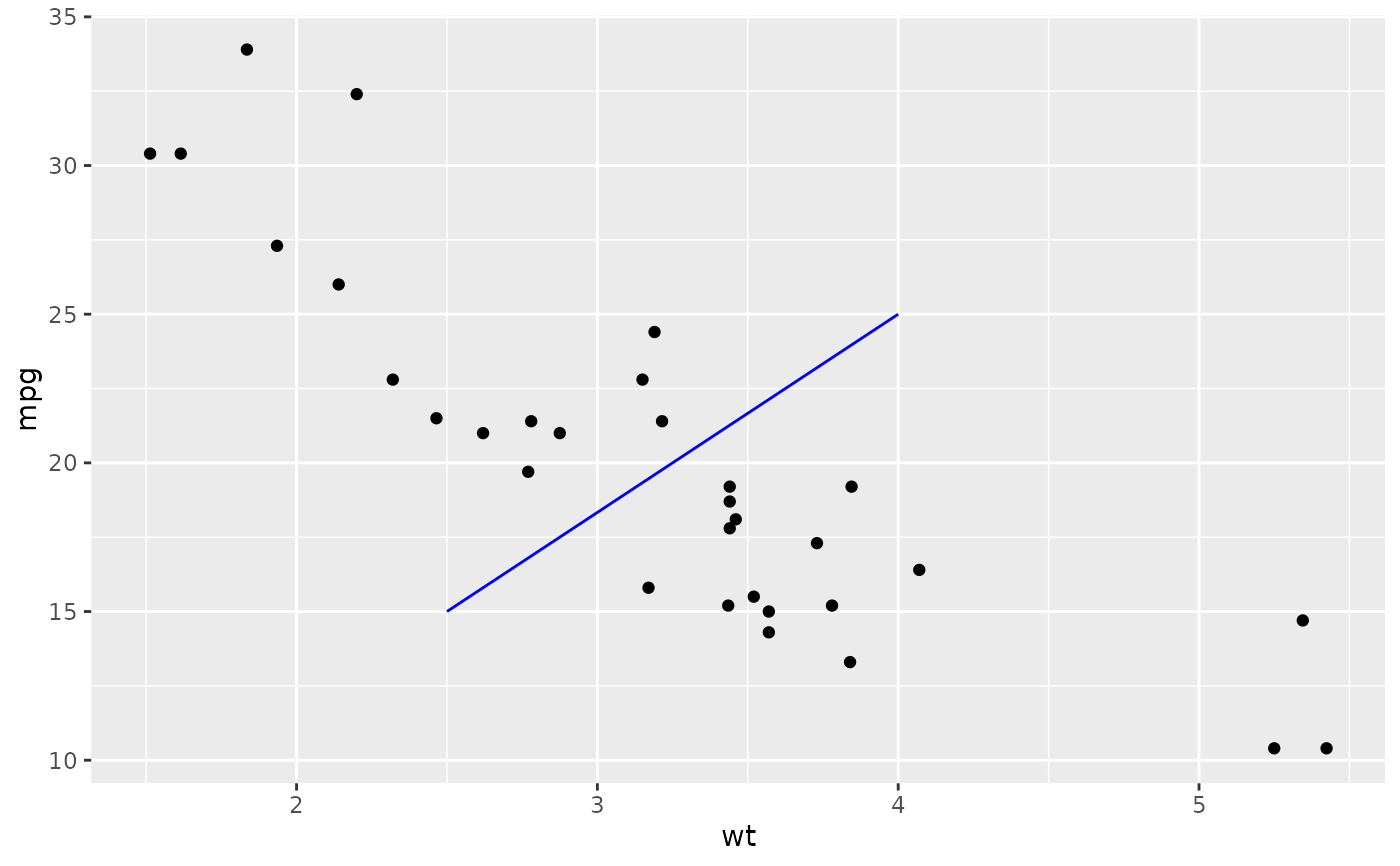
 p + annotate("segment", x = 2.5, xend = 4, y = 15, yend = 25,
colour = "blue")
p + annotate("segment", x = 2.5, xend = 4, y = 15, yend = 25,
colour = "blue")
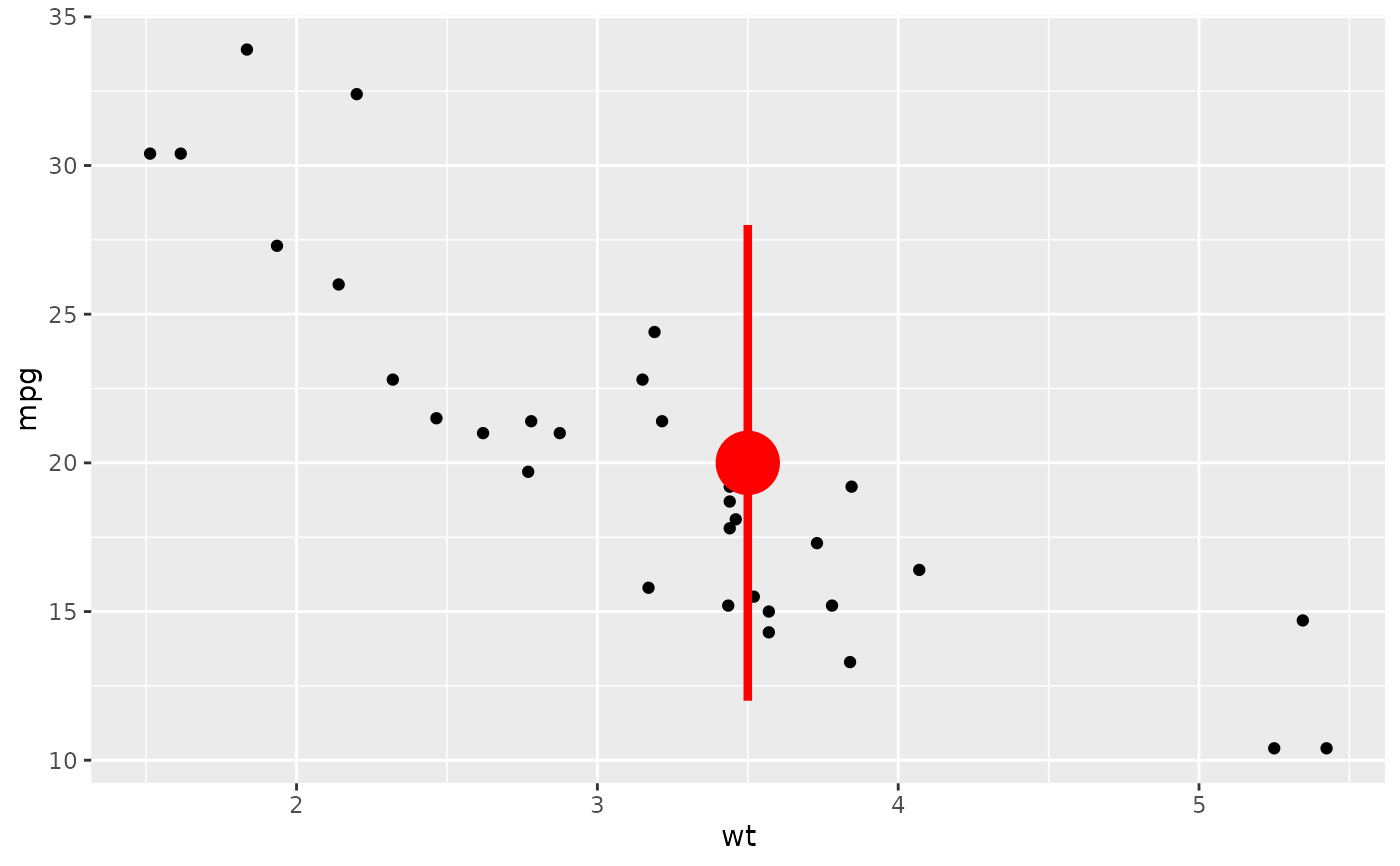
 p + annotate("pointrange", x = 3.5, y = 20, ymin = 12, ymax = 28,
colour = "red", size = 2.5, linewidth = 1.5)
p + annotate("pointrange", x = 3.5, y = 20, ymin = 12, ymax = 28,
colour = "red", size = 2.5, linewidth = 1.5)
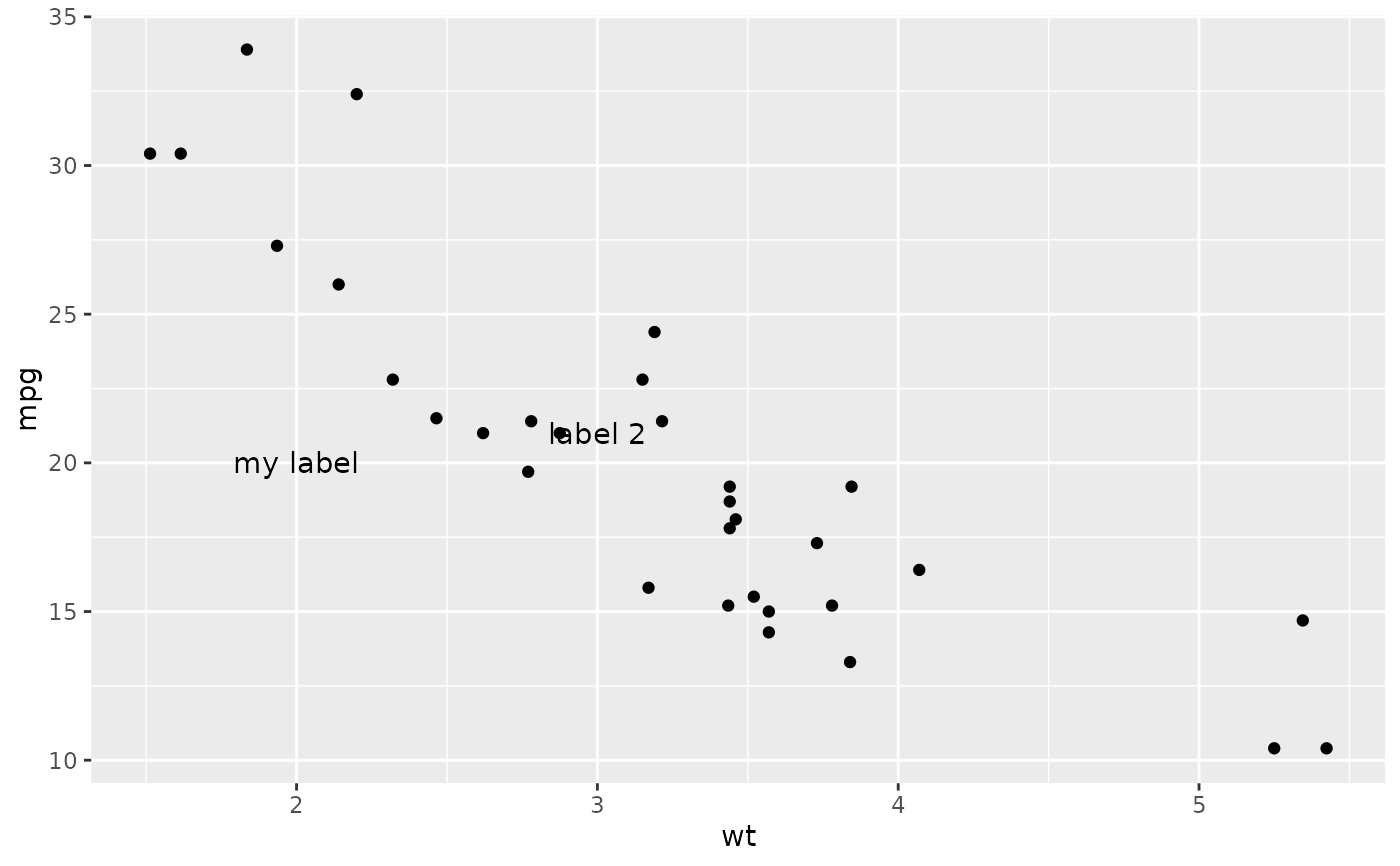
 p + annotate("text", x = 2:3, y = 20:21, label = c("my label", "label 2"))
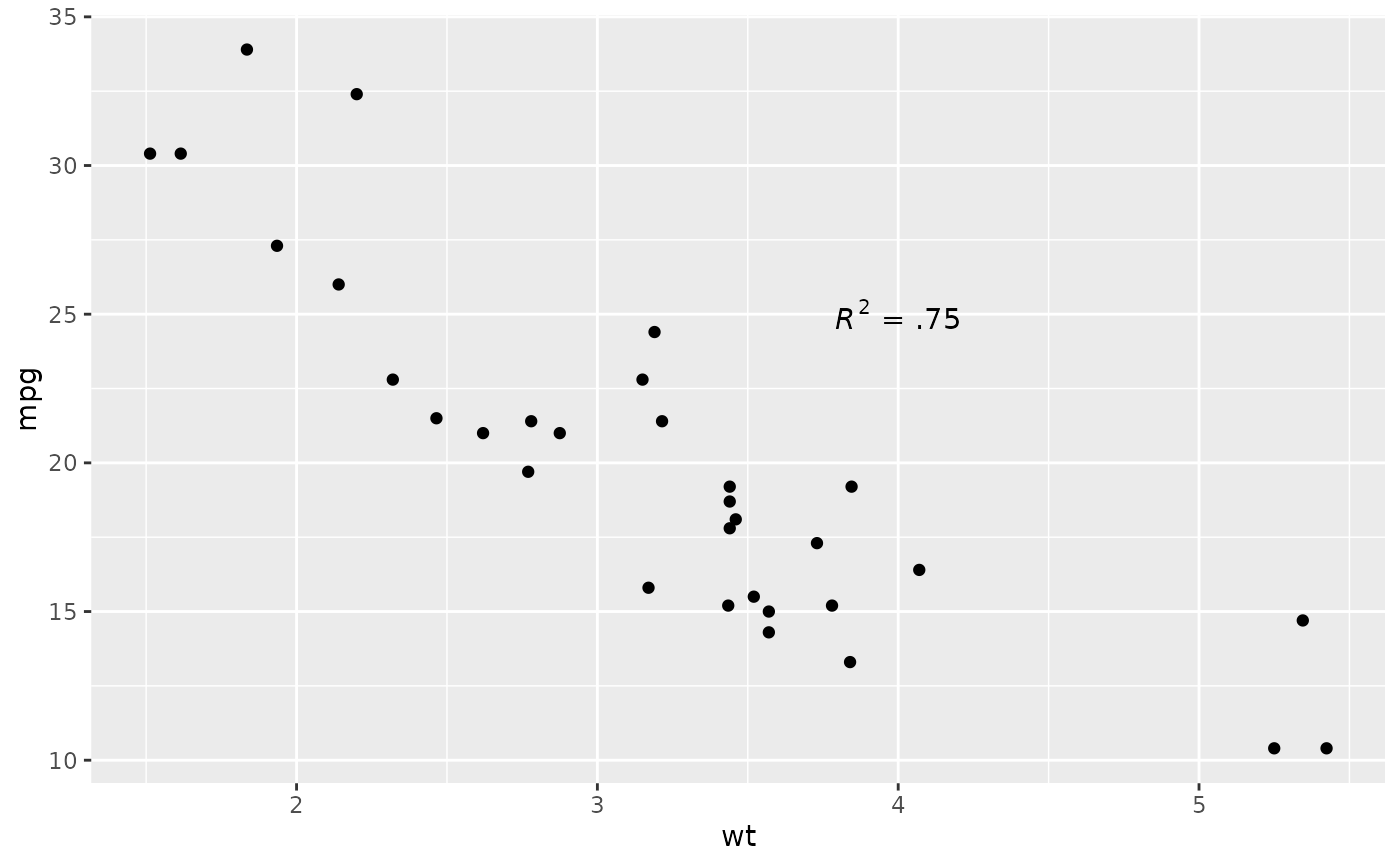
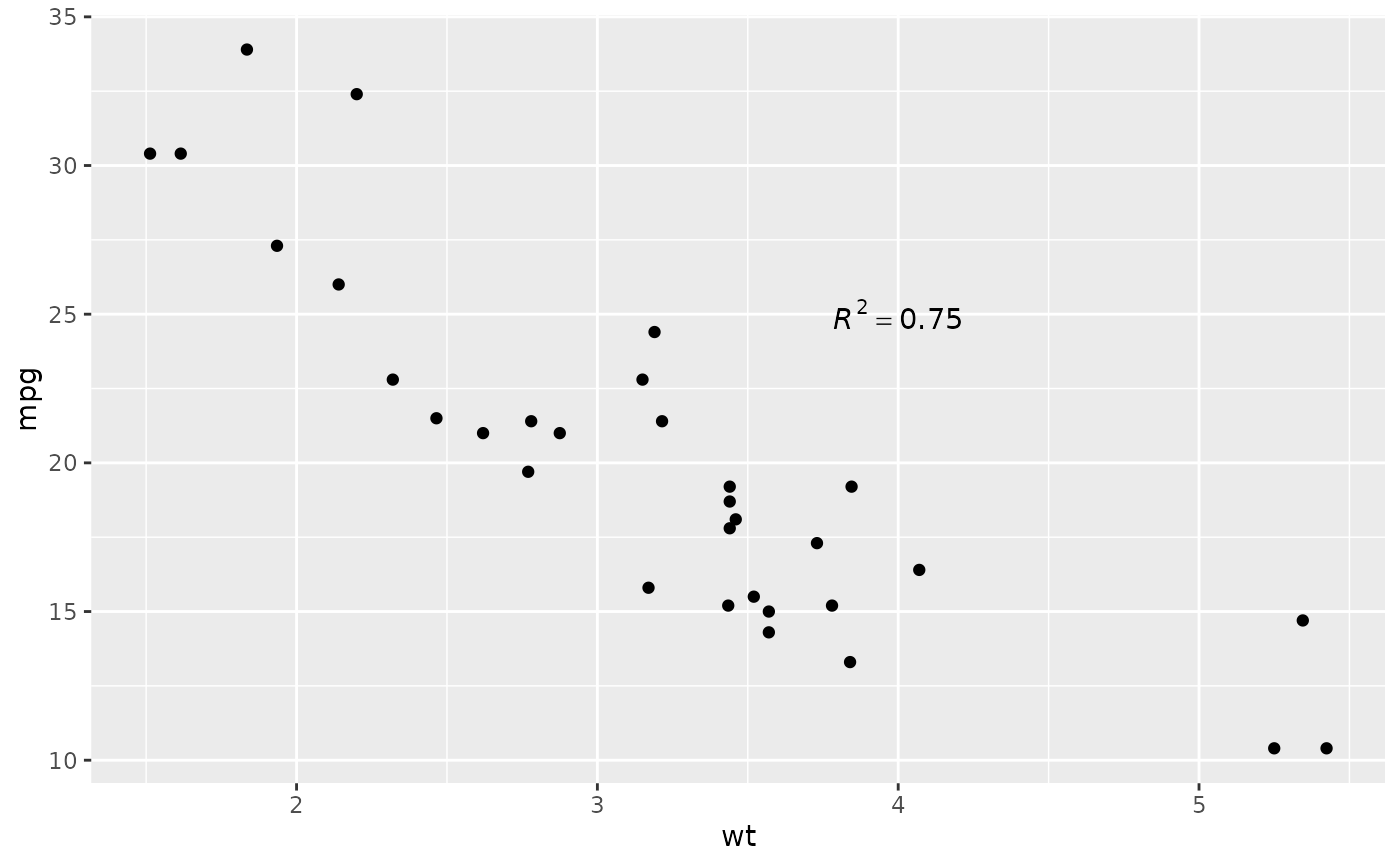
 p + annotate("text", x = 4, y = 25, label = "italic(R) ^ 2 == 0.75",
parse = TRUE)
p + annotate("text", x = 4, y = 25, label = "italic(R) ^ 2 == 0.75",
parse = TRUE)
 p + annotate("text", x = 4, y = 25,
label = "paste(italic(R) ^ 2, \" = .75\")", parse = TRUE)
p + annotate("text", x = 4, y = 25,
label = "paste(italic(R) ^ 2, \" = .75\")", parse = TRUE)