Axis guides are the visual representation of position scales like those created with scale_(x|y)_continuous() and scale_(x|y)_discrete().
Arguments
- title
A character string or expression indicating a title of guide. If
NULL, the title is not shown. By default (waiver()), the name of the scale object or the name specified inlabs()is used for the title.- theme
A
themeobject to style the guide individually or differently from the plot's theme settings. Thethemeargument in the guide partially overrides, and is combined with, the plot's theme.- check.overlap
silently remove overlapping labels, (recursively) prioritizing the first, last, and middle labels.
- angle
Compared to setting the angle in
theme()/element_text(), this also uses some heuristics to automatically pick thehjustandvjustthat you probably want. Can be one of the following:NULLto take the angles andhjust/vjustdirectly from the theme.waiver()to allow reasonable defaults in special cases.A number representing the text angle in degrees.
- n.dodge
The number of rows (for vertical axes) or columns (for horizontal axes) that should be used to render the labels. This is useful for displaying labels that would otherwise overlap.
- minor.ticks
Whether to draw the minor ticks (
TRUE) or not draw minor ticks (FALSE, default).- cap
A
characterto cut the axis line back to the last breaks. Can be"none"(default) to draw the axis line along the whole panel, or"upper"and"lower"to draw the axis to the upper or lower break, or"both"to only draw the line in between the most extreme breaks.TRUEandFALSEare shorthand for"both"and"none"respectively.- order
A positive
integerof length 1 that specifies the order of this guide among multiple guides. This controls in which order guides are merged if there are multiple guides for the same position. If 0 (default), the order is determined by a secret algorithm.- position
Where this guide should be drawn: one of top, bottom, left, or right.
Examples
# plot with overlapping text
p <- ggplot(mpg, aes(cty * 100, hwy * 100)) +
geom_point() +
facet_wrap(vars(class))
# axis guides can be customized in the scale_* functions or
# using guides()
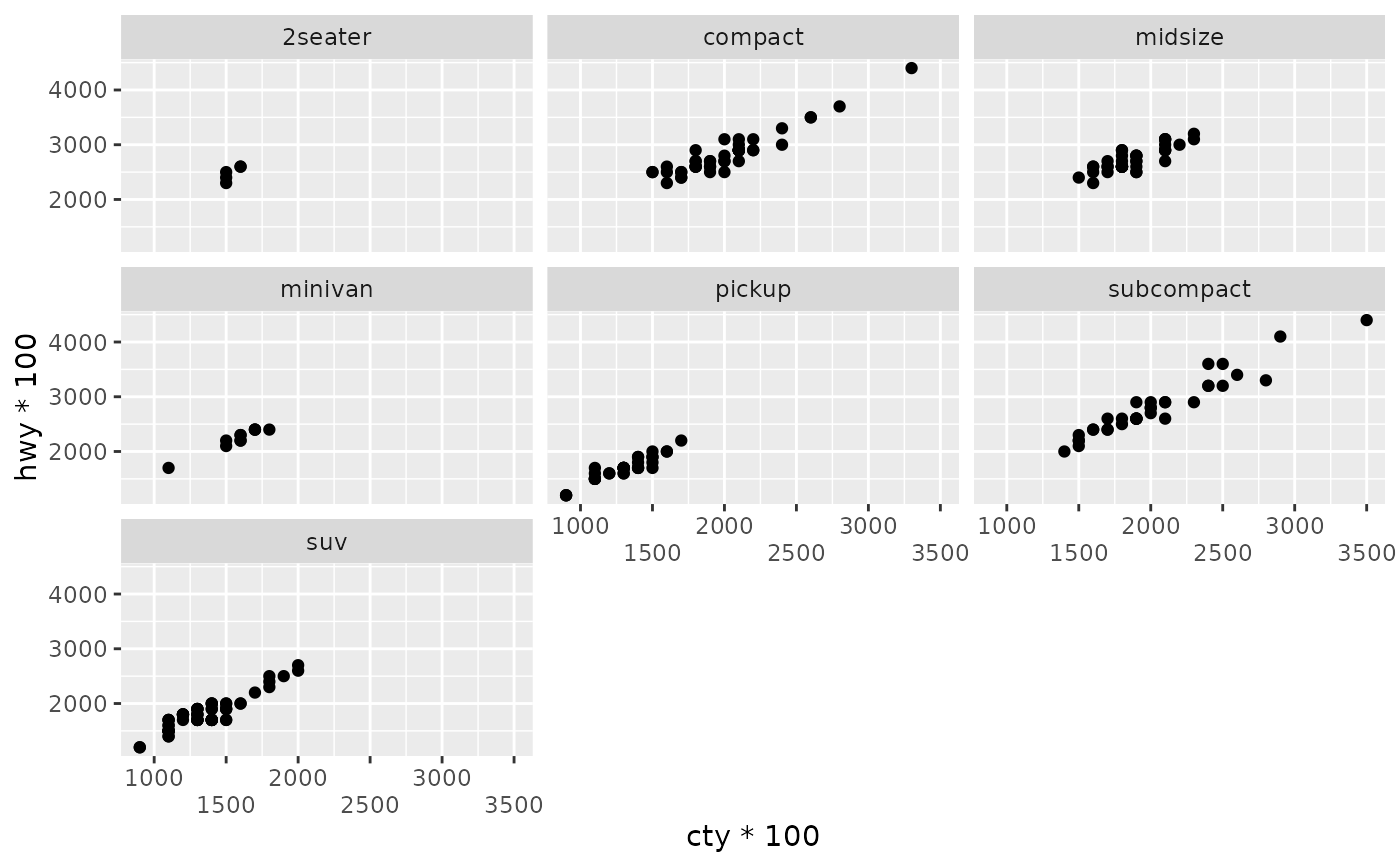
p + scale_x_continuous(guide = guide_axis(n.dodge = 2))
 p + guides(x = guide_axis(angle = 90))
 # can also be used to add a duplicate guide
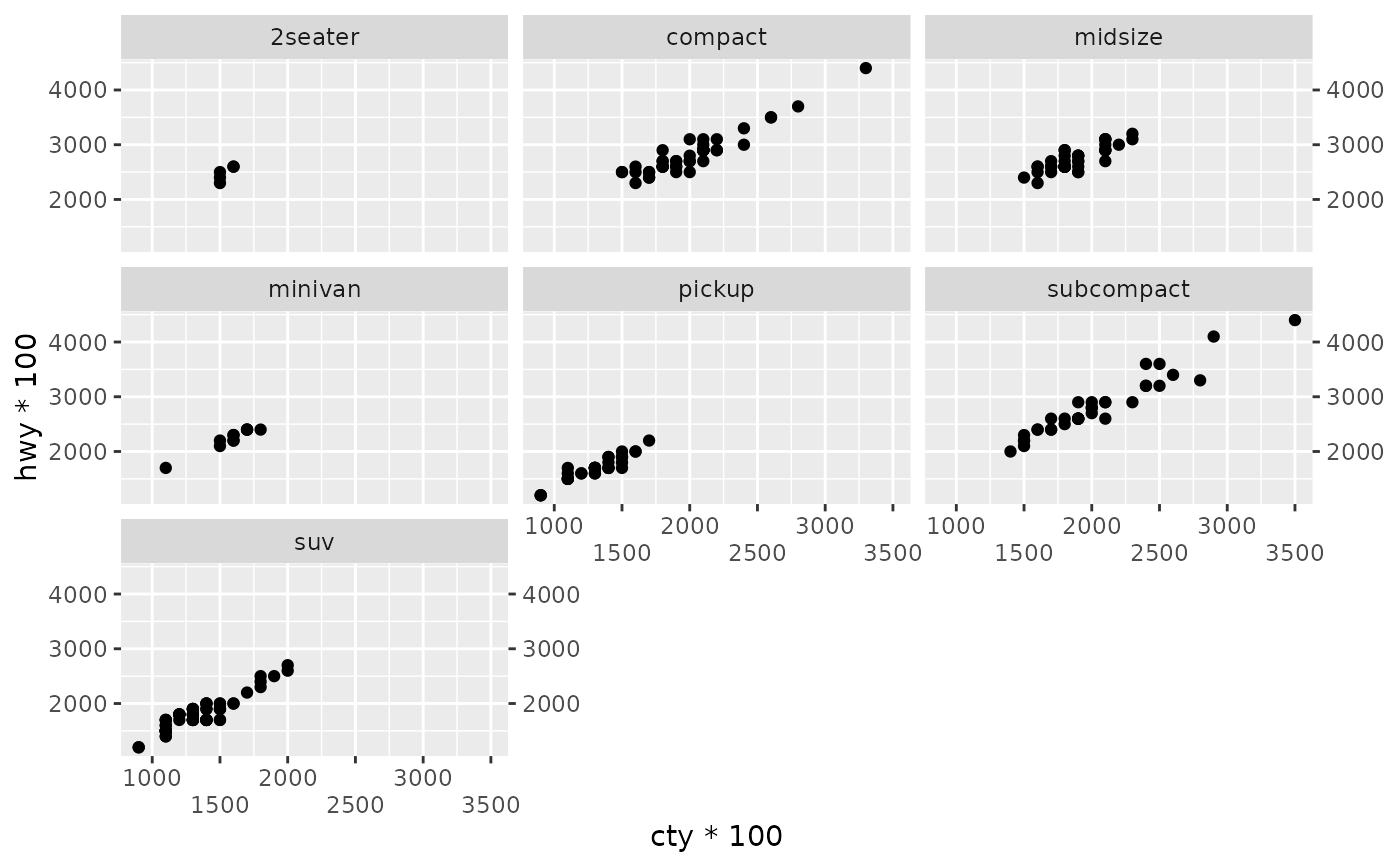
p + guides(x = guide_axis(n.dodge = 2), y.sec = guide_axis())
# can also be used to add a duplicate guide
p + guides(x = guide_axis(n.dodge = 2), y.sec = guide_axis())