Generally, you do not need to print or plot a ggplot2 plot explicitly: the
default top-level print method will do it for you. You will, however, need
to call print() explicitly if you want to draw a plot inside a
function or for loop.
Examples
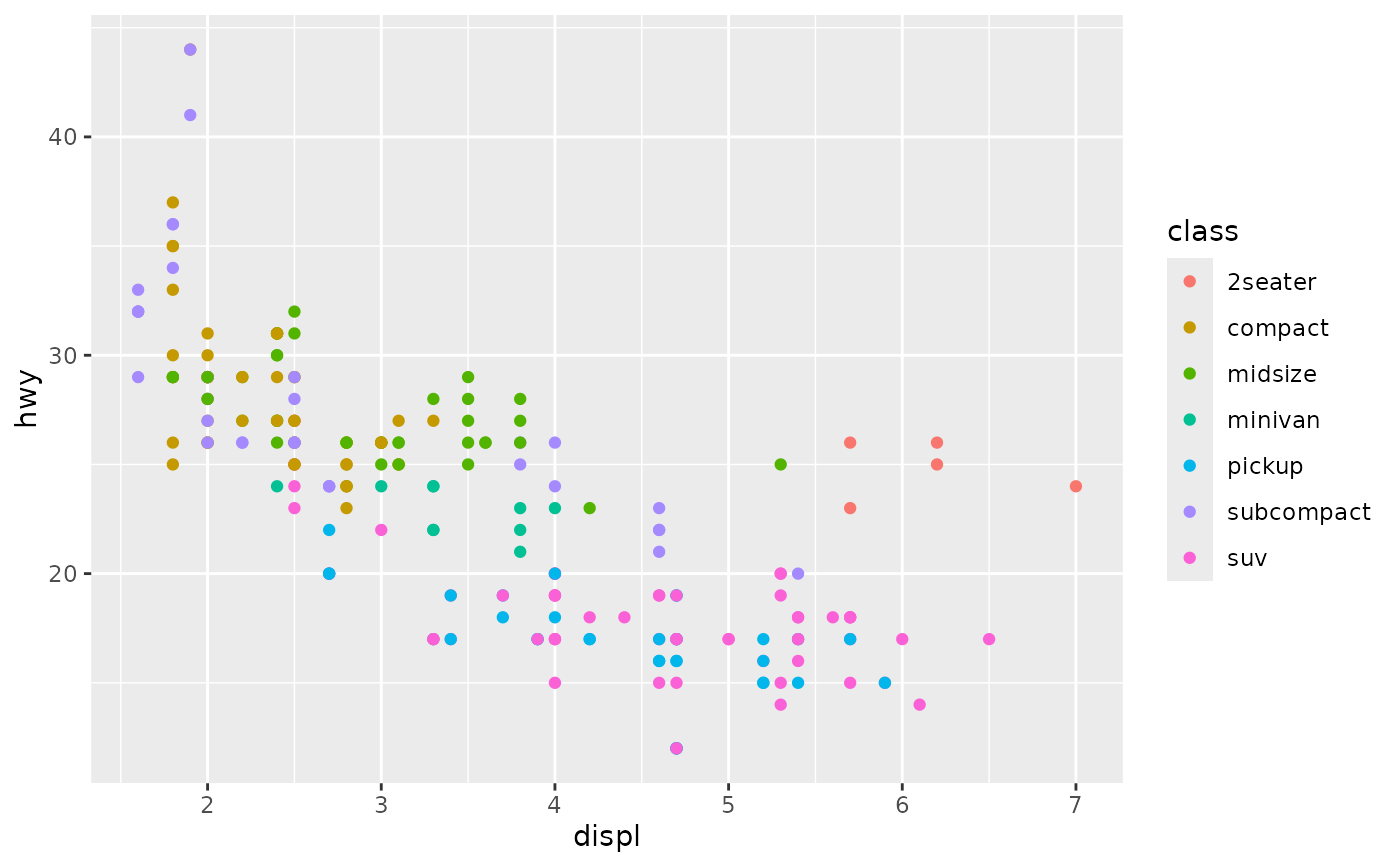
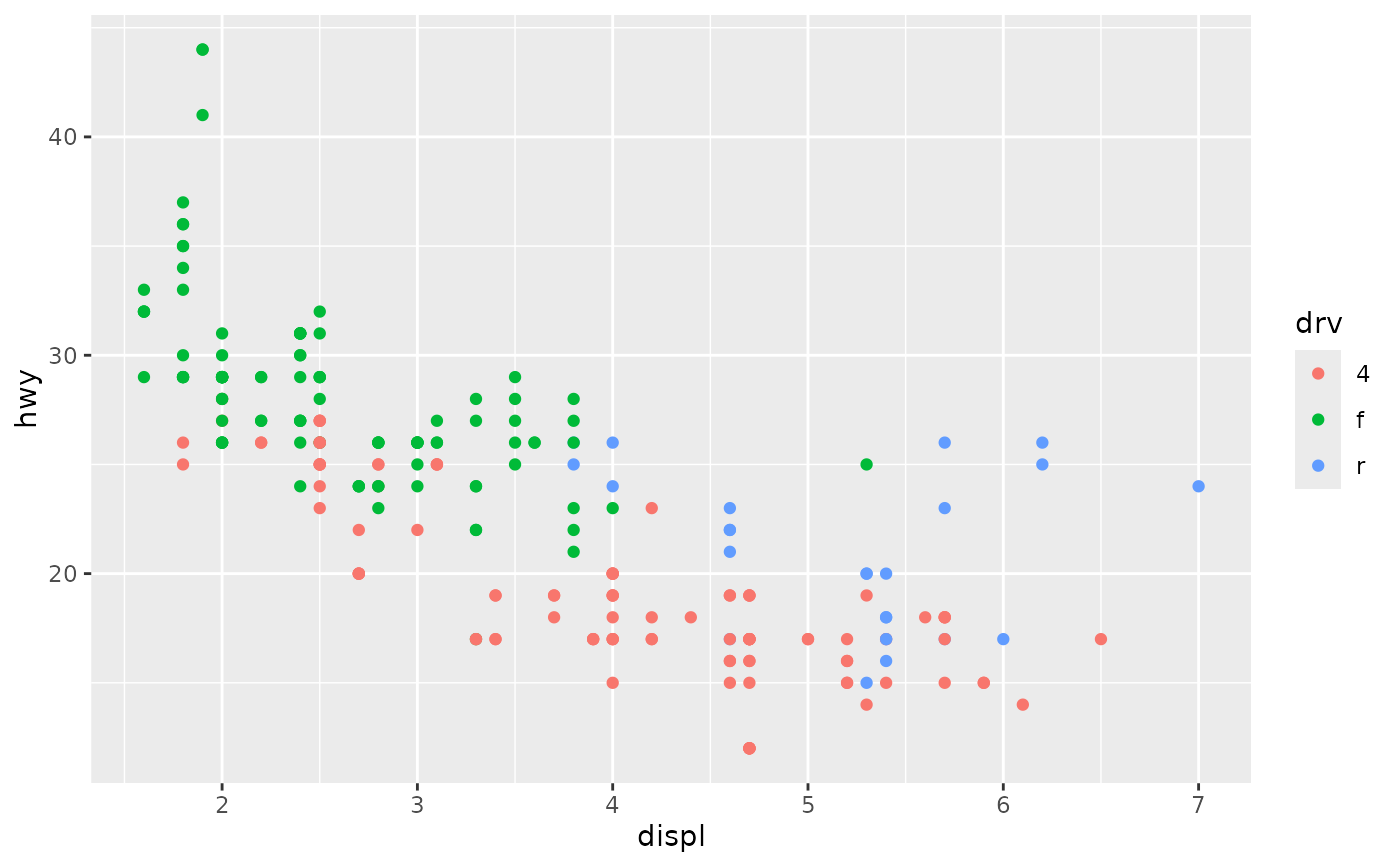
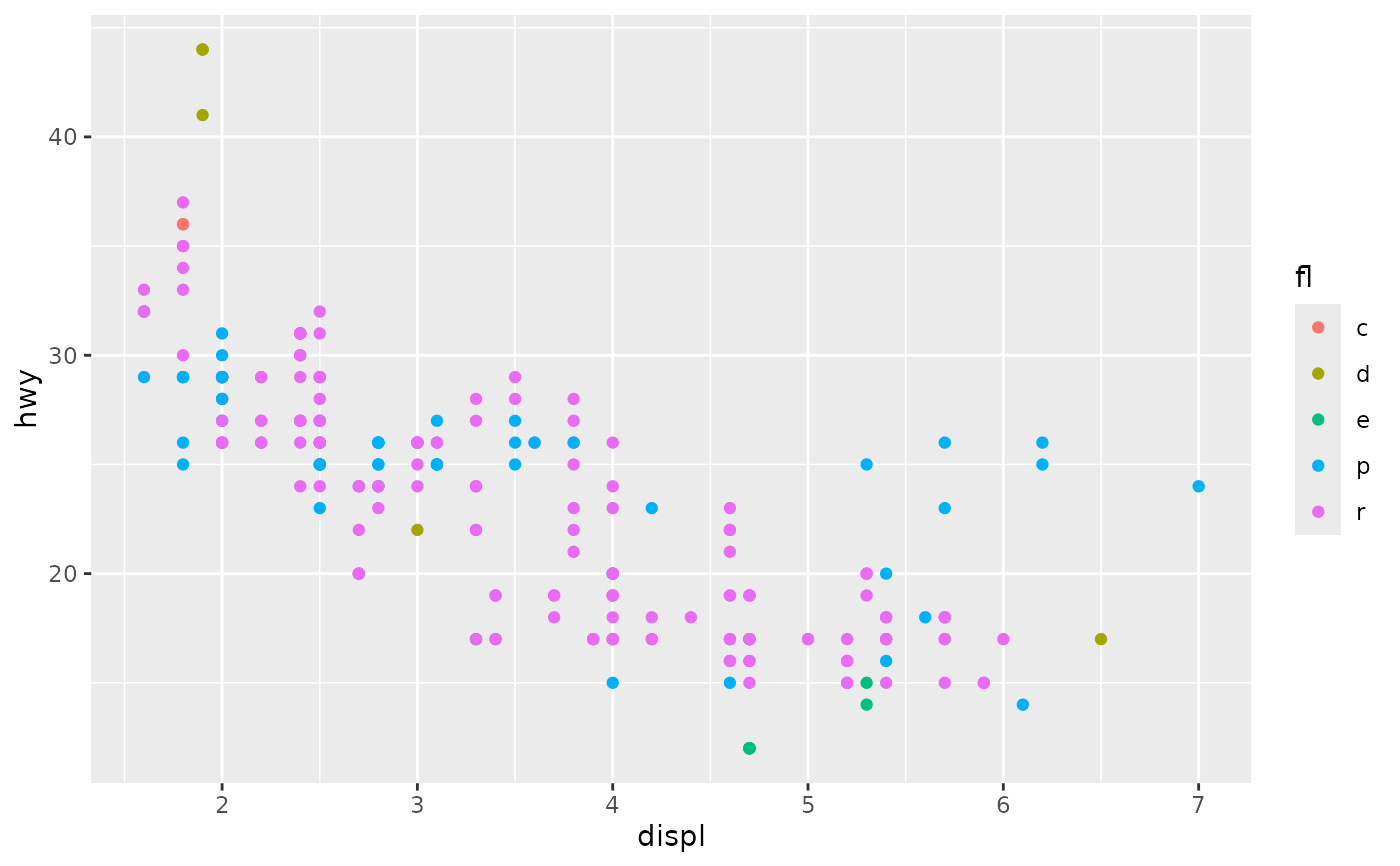
colours <- c("class", "drv", "fl")

# Doesn't seem to do anything!
for (colour in colours) {
  ggplot(mpg, aes(displ, hwy, colour = .data[[colour]])) +
    geom_point()
}

for (colour in colours) {
  print(ggplot(mpg, aes(displ, hwy, colour = .data[[colour]])) +
          geom_point())
}