![[Deprecated]](figures/lifecycle-deprecated.svg)
This function turns a map into a data frame that can more easily be plotted with ggplot2.
Usage
# S3 method for class 'map'
fortify(model, data, ...)Examples
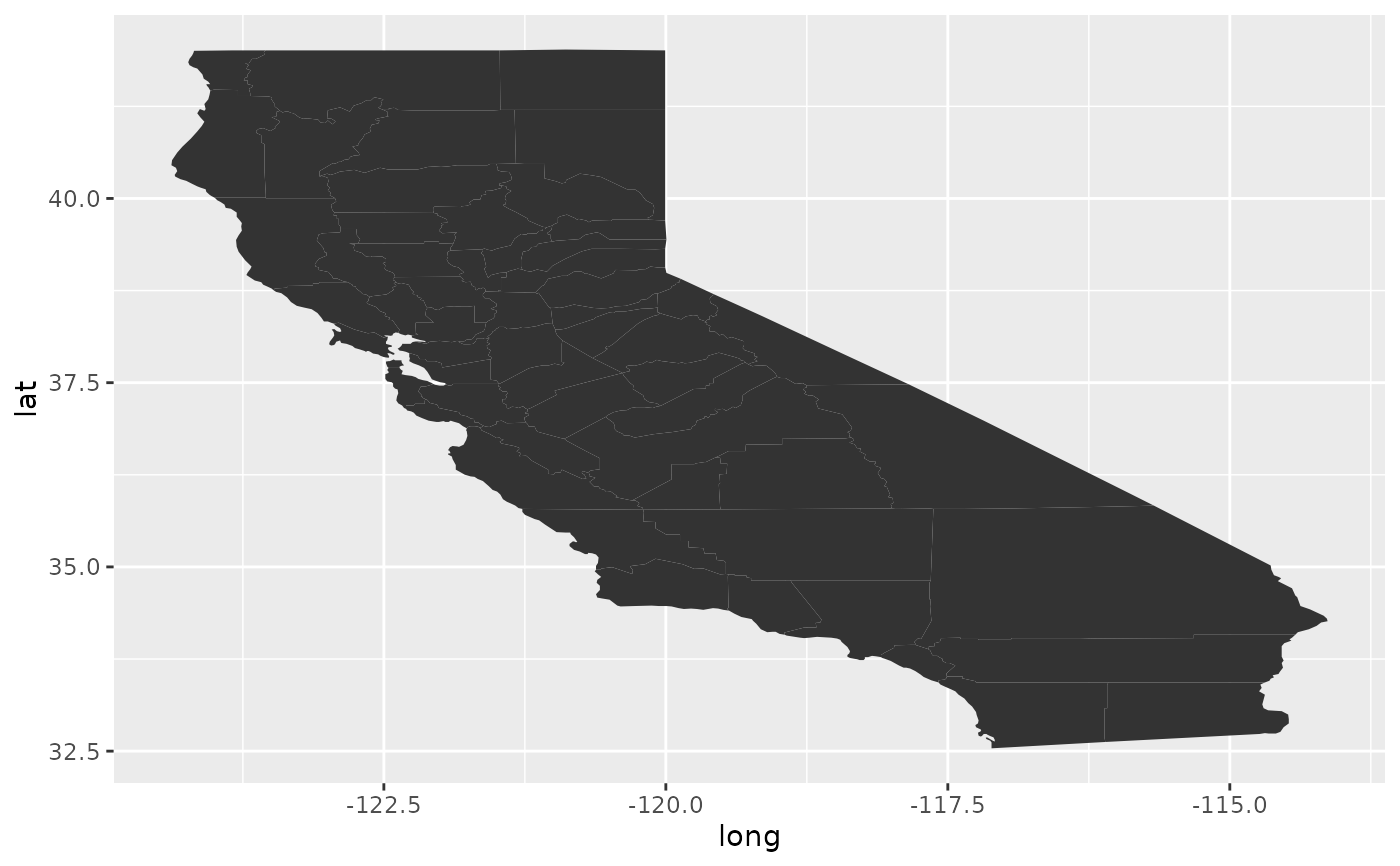
if (require("maps")) {
ca <- map("county", "ca", plot = FALSE, fill = TRUE)
head(fortify(ca))
ggplot(ca, aes(long, lat)) +
geom_polygon(aes(group = group))
}
#> Warning: `fortify(<map>)` was deprecated in ggplot2 4.0.0.
#> ℹ Please use `map_data()` instead.
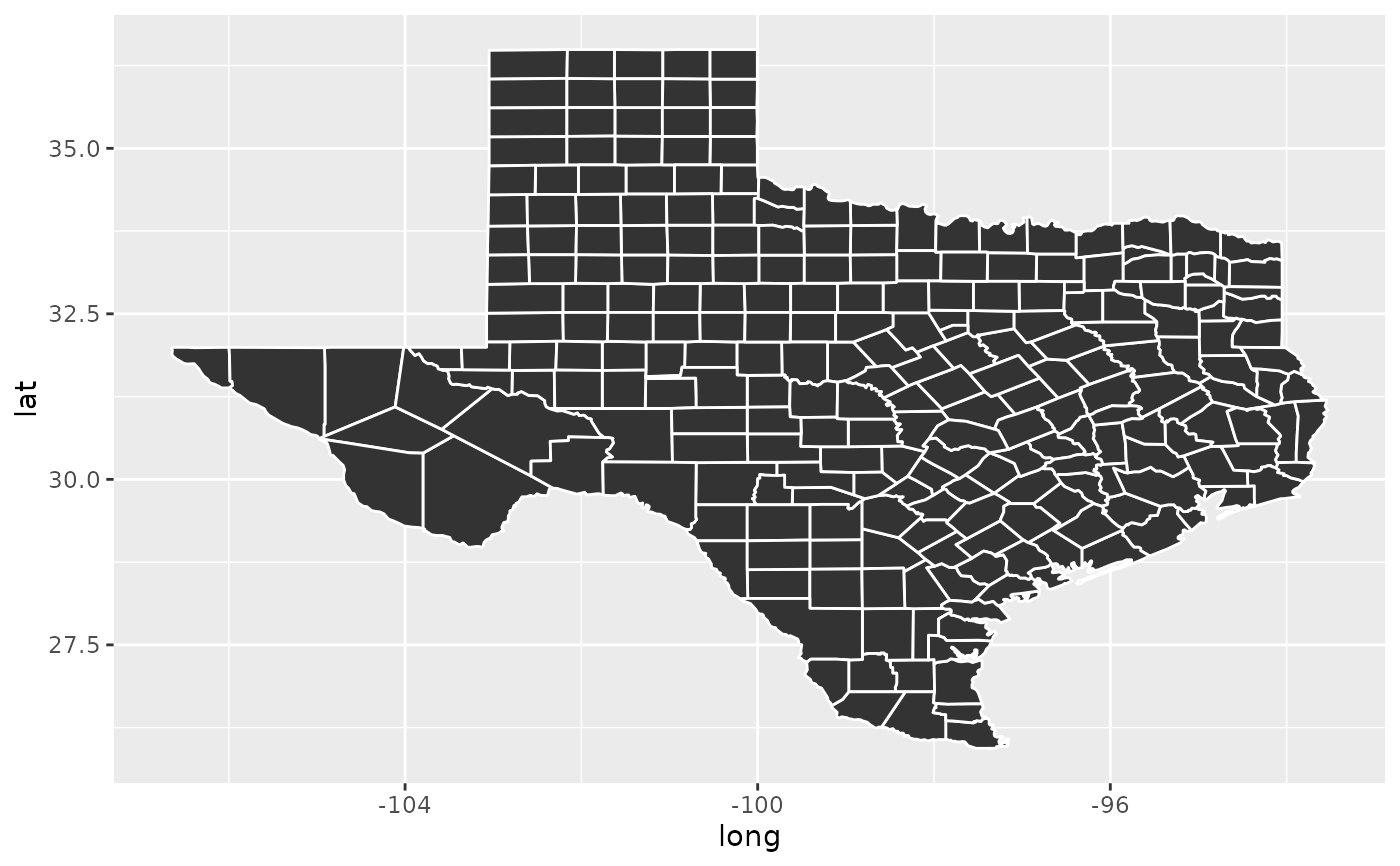
 if (require("maps")) {
tx <- map("county", "texas", plot = FALSE, fill = TRUE)
head(fortify(tx))
ggplot(tx, aes(long, lat)) +
geom_polygon(aes(group = group), colour = "white")
}
if (require("maps")) {
tx <- map("county", "texas", plot = FALSE, fill = TRUE)
head(fortify(tx))
ggplot(tx, aes(long, lat)) +
geom_polygon(aes(group = group), colour = "white")
}