This is a special guide that can be used to display any graphical object (grob) along with the regular guides. This guide has no associated scale.
Usage
guide_custom(
  grob,
  width = grobWidth(grob),
  height = grobHeight(grob),
  title = NULL,
  theme = NULL,
  position = NULL,
  order = 0
)
Arguments
- grob
A grob to display.
- width, height
The allocated width and height to display the grob, given in
grid::unit()s.- title
A character string or expression indicating the title of guide. If
NULL(default), no title is shown.- theme
A
themeobject to style the guide individually or differently from the plot's theme settings. Thethemeargument in the guide overrides, and is combined with, the plot's theme.- position
A character string indicating where the legend should be placed relative to the plot panels.
- order
positive integer less than 99 that specifies the order of this guide among multiple guides. This controls the order in which multiple guides are displayed, not the contents of the guide itself. If 0 (default), the order is determined by a secret algorithm.
Examples
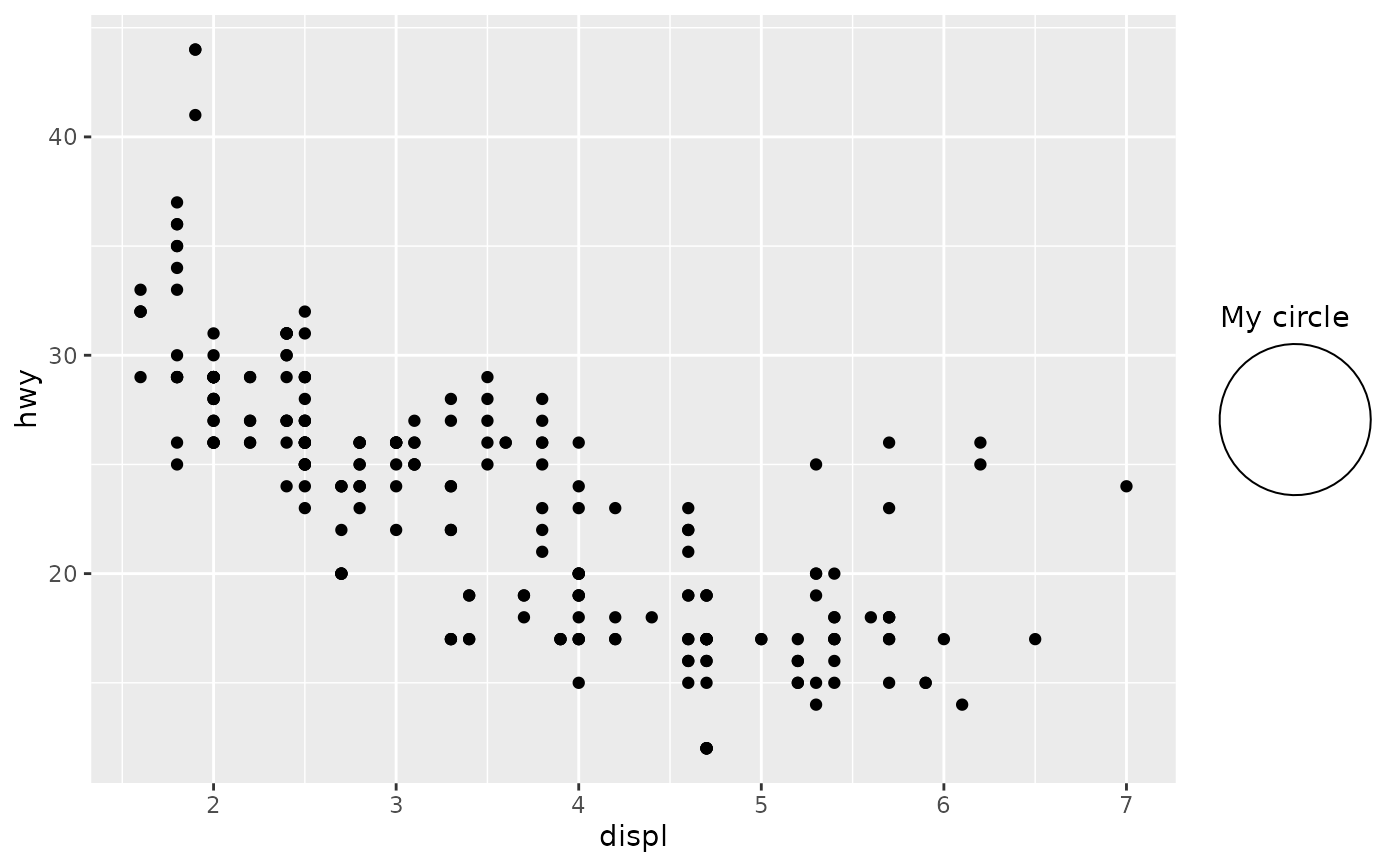
# A standard plot
p <- ggplot(mpg, aes(displ, hwy)) +
geom_point()
# Define a graphical object
circle <- grid::circleGrob()
# Rendering a grob as a guide
p + guides(custom = guide_custom(circle, title = "My circle"))
 # Controlling the size of the grob defined in relative units
p + guides(custom = guide_custom(
circle, title = "My circle",
width = unit(2, "cm"), height = unit(2, "cm"))
)
# Controlling the size of the grob defined in relative units
p + guides(custom = guide_custom(
circle, title = "My circle",
width = unit(2, "cm"), height = unit(2, "cm"))
)
 # Size of grobs in absolute units is taken directly without the need to
# set these manually
p + guides(custom = guide_custom(
title = "My circle",
grob = grid::circleGrob(r = unit(1, "cm"))
))
# Size of grobs in absolute units is taken directly without the need to
# set these manually
p + guides(custom = guide_custom(
title = "My circle",
grob = grid::circleGrob(r = unit(1, "cm"))
))