This is a specialised guide used in coord_radial() to represent the theta
position scale.
Arguments
- title
A character string or expression indicating a title of guide. If
NULL, the title is not shown. By default (waiver()), the name of the scale object or the name specified inlabs()is used for the title.- theme
A
themeobject to style the guide individually or differently from the plot's theme settings. Thethemeargument in the guide overrides, and is combined with, the plot's theme.- angle
Compared to setting the angle in
theme()/element_text(), this also uses some heuristics to automatically pick thehjustandvjustthat you probably want. Can be one of the following:NULLto take the angles andhjust/vjustdirectly from the theme.waiver()to allow reasonable defaults in special cases.A number representing the text angle in degrees.
- minor.ticks
Whether to draw the minor ticks (
TRUE) or not draw minor ticks (FALSE, default).- cap
A
characterto cut the axis line back to the last breaks. Can be"none"(default) to draw the axis line along the whole panel, or"upper"and"lower"to draw the axis to the upper or lower break, or"both"to only draw the line in between the most extreme breaks.TRUEandFALSEare shorthand for"both"and"none"respectively.- order
A positive
integerof length 1 that specifies the order of this guide among multiple guides. This controls in which order guides are merged if there are multiple guides for the same position. If 0 (default), the order is determined by a secret algorithm.- position
Where this guide should be drawn: one of top, bottom, left, or right.
Note
The axis labels in this guide are insensitive to hjust and vjust
settings. The distance from the tick marks to the labels is determined by
the largest margin size set in the theme.
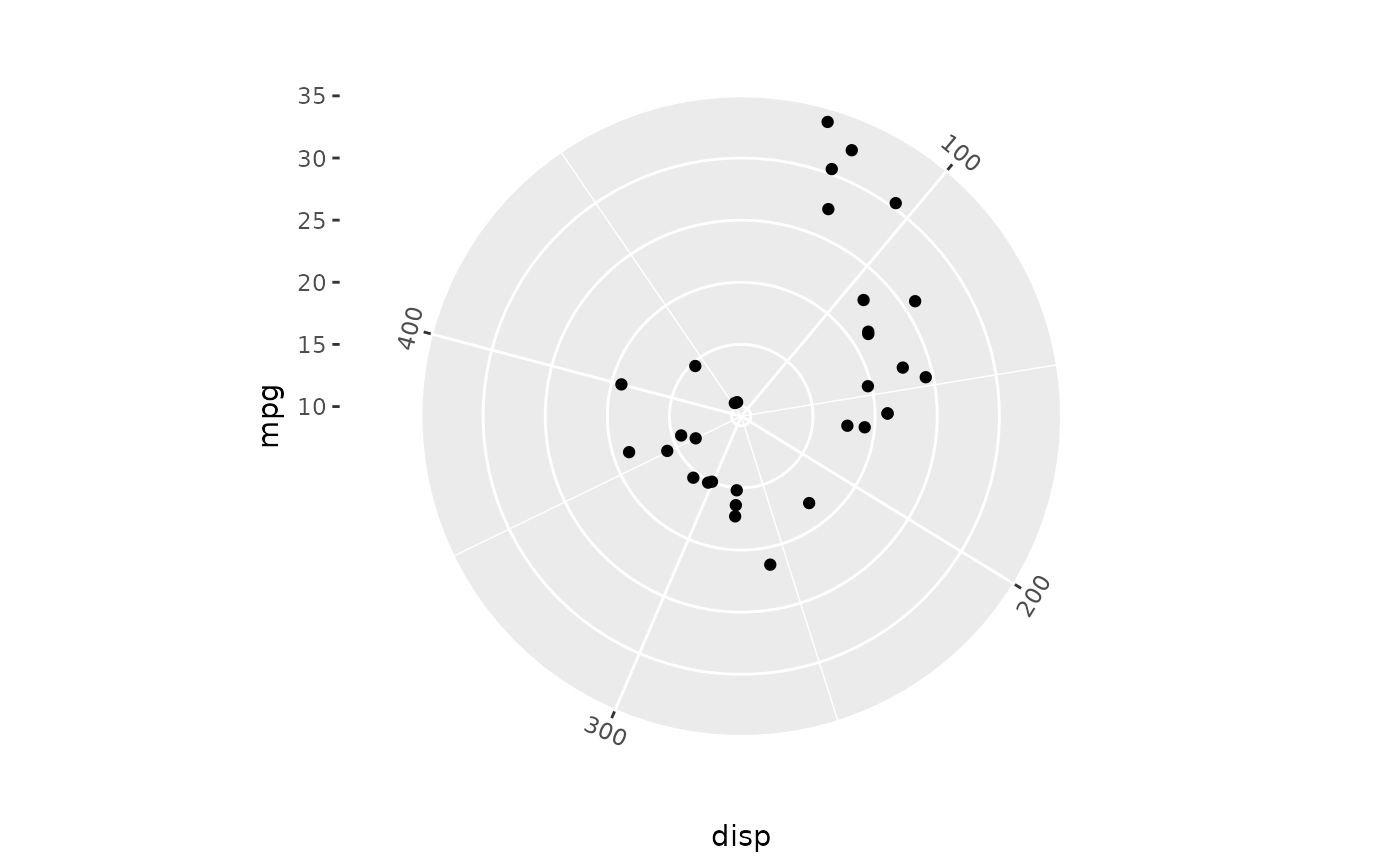
Examples
# A plot using coord_radial
p <- ggplot(mtcars, aes(disp, mpg)) +
  geom_point() +
  coord_radial()

# The `angle` argument can be used to set relative angles
p + guides(theta = guide_axis_theta(angle = 0))