qplot() is now deprecated in order to encourage the users to
learn ggplot() as it makes it easier to create complex graphics.
Usage
qplot(
  x,
  y,
  ...,
  data,
  facets = NULL,
  margins = FALSE,
  geom = "auto",
  xlim = c(NA, NA),
  ylim = c(NA, NA),
  log = "",
  main = NULL,
  xlab = NULL,
  ylab = NULL,
  asp = NA,
  stat = deprecated(),
  position = deprecated()
)

quickplot(
  x,
  y,
  ...,
  data,
  facets = NULL,
  margins = FALSE,
  geom = "auto",
  xlim = c(NA, NA),
  ylim = c(NA, NA),
  log = "",
  main = NULL,
  xlab = NULL,
  ylab = NULL,
  asp = NA,
  stat = deprecated(),
  position = deprecated()
)
Arguments
- x, y, ...
Aesthetics passed into each layer
- data
Data frame to use (optional). If not specified, will create one, extracting vectors from the current environment.
- facets
faceting formula to use. Picks
facet_wrap()orfacet_grid()depending on whether the formula is one- or two-sided- margins
See
facet_grid(): display marginal facets?- geom
Character vector specifying geom(s) to draw. Defaults to "point" if x and y are specified, and "histogram" if only x is specified.
- xlim, ylim
X and y axis limits
- log
Which variables to log transform ("x", "y", or "xy")
- main, xlab, ylab
Character vector (or expression) giving plot title, x axis label, and y axis label respectively.
- asp
The y/x aspect ratio
- stat, position
![[Deprecated]](figures/lifecycle-deprecated.svg)
Examples
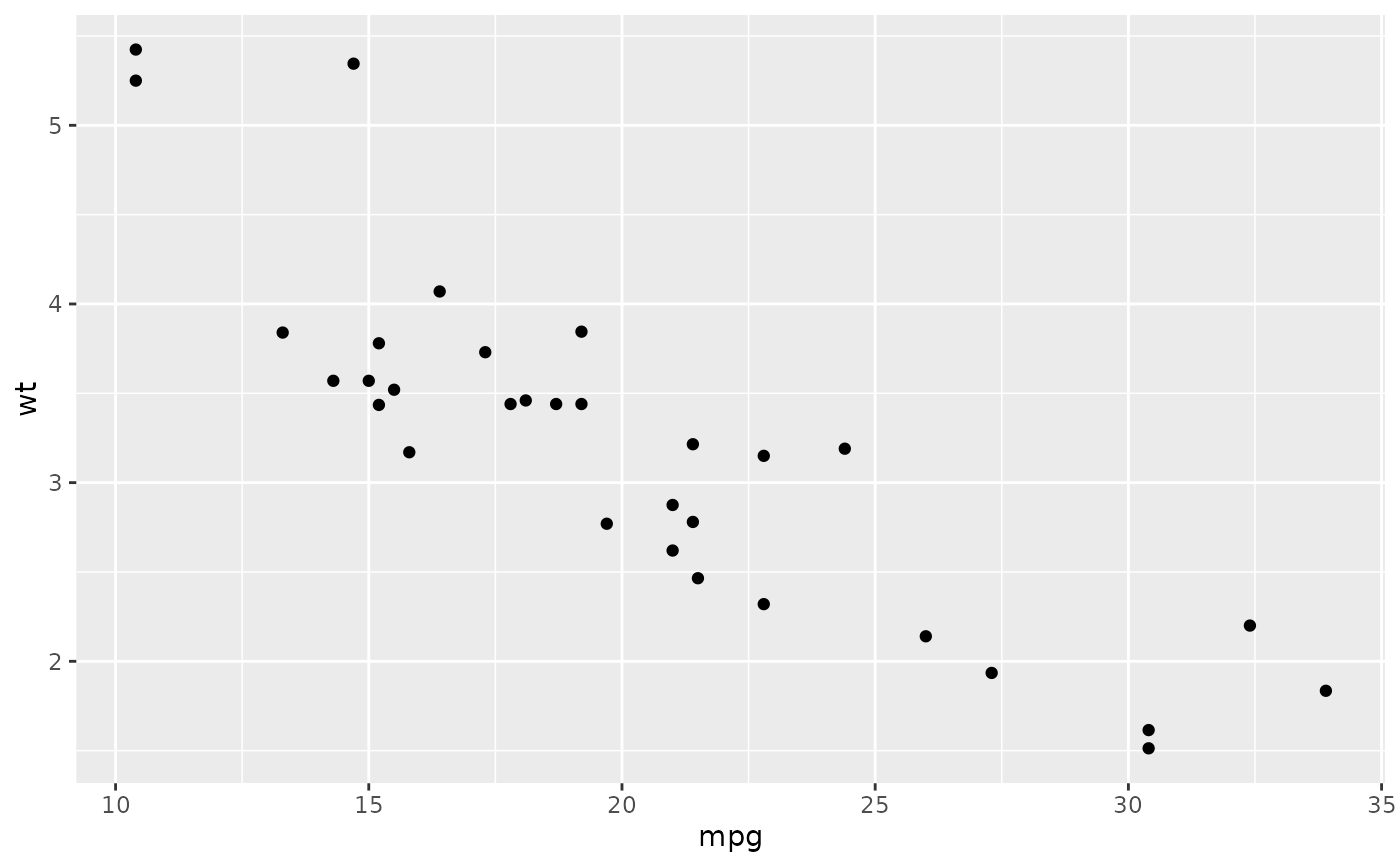
# Use data from data.frame
qplot(mpg, wt, data = mtcars)
#> Warning: `qplot()` was deprecated in ggplot2 3.4.0.
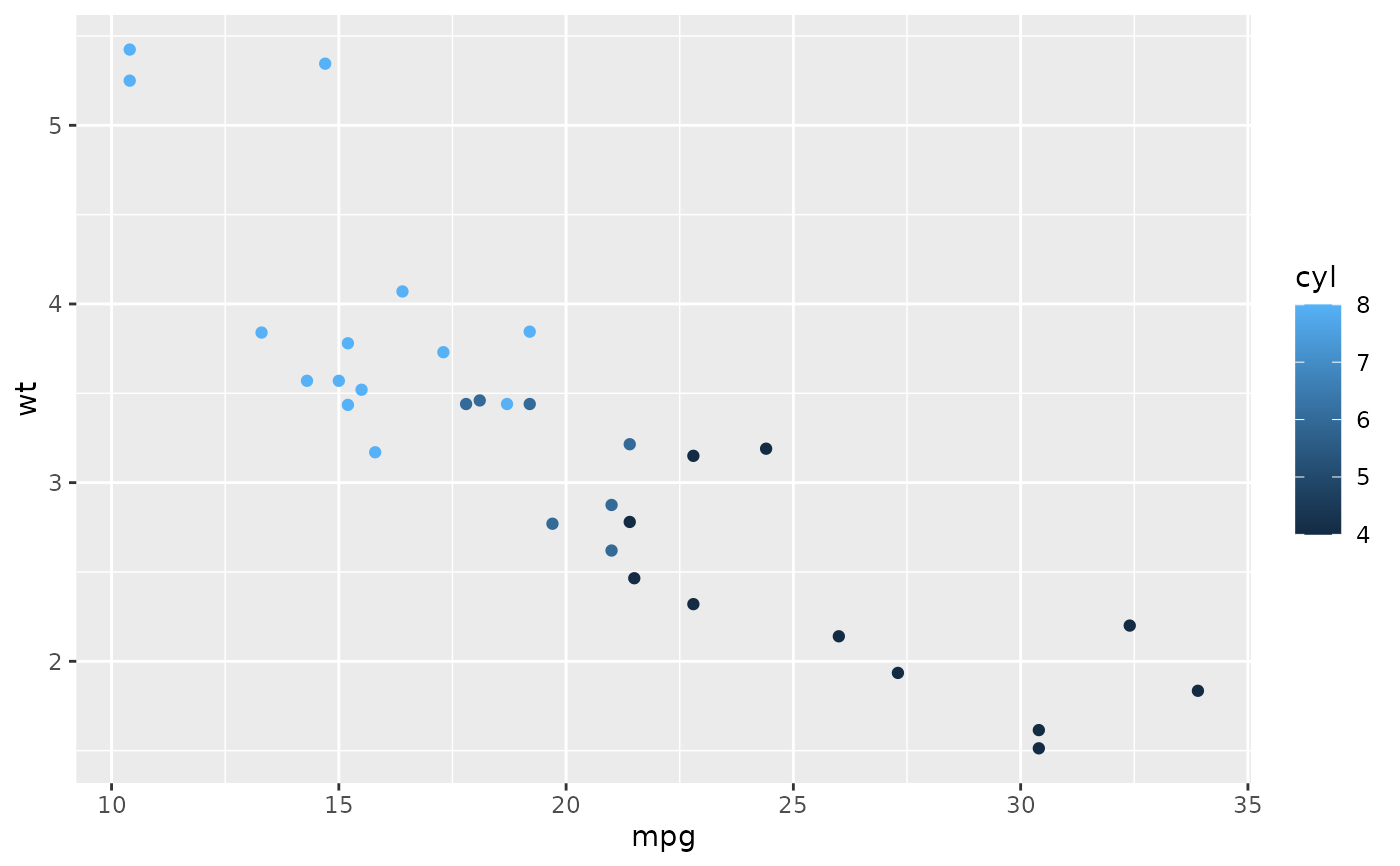
 qplot(mpg, wt, data = mtcars, colour = cyl)
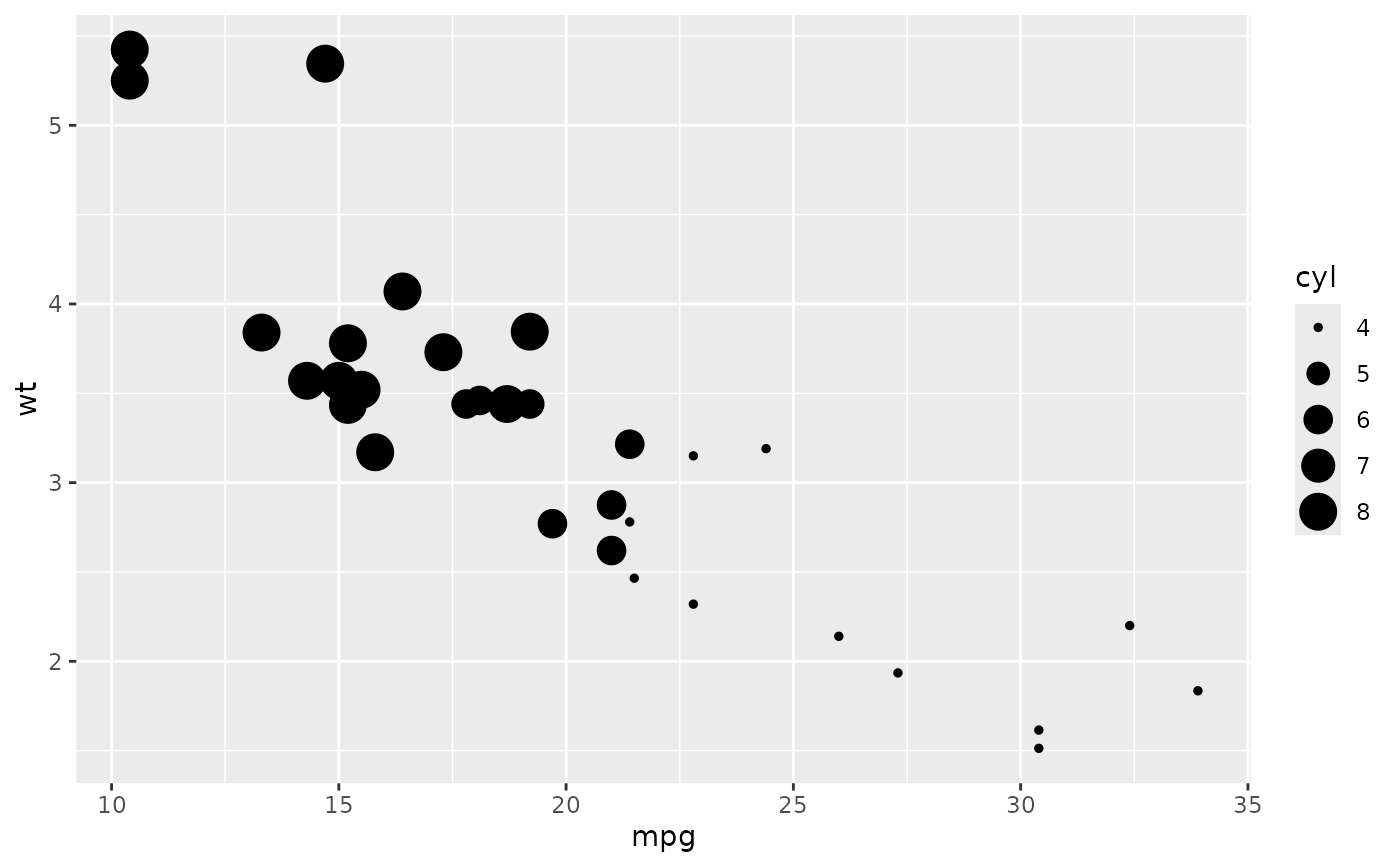
 qplot(mpg, wt, data = mtcars, size = cyl)
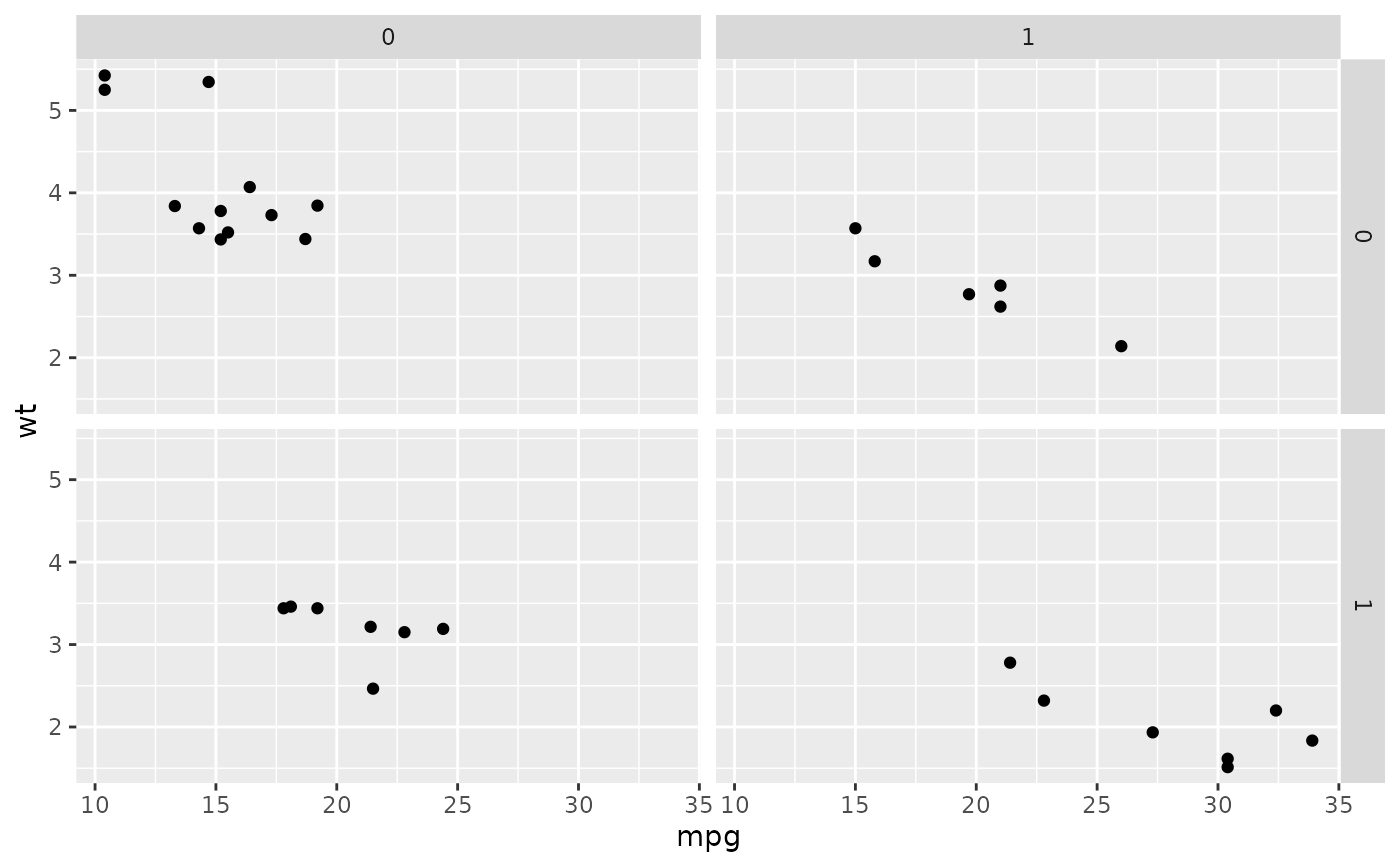
 qplot(mpg, wt, data = mtcars, facets = vs ~ am)
 # \donttest{
set.seed(1)
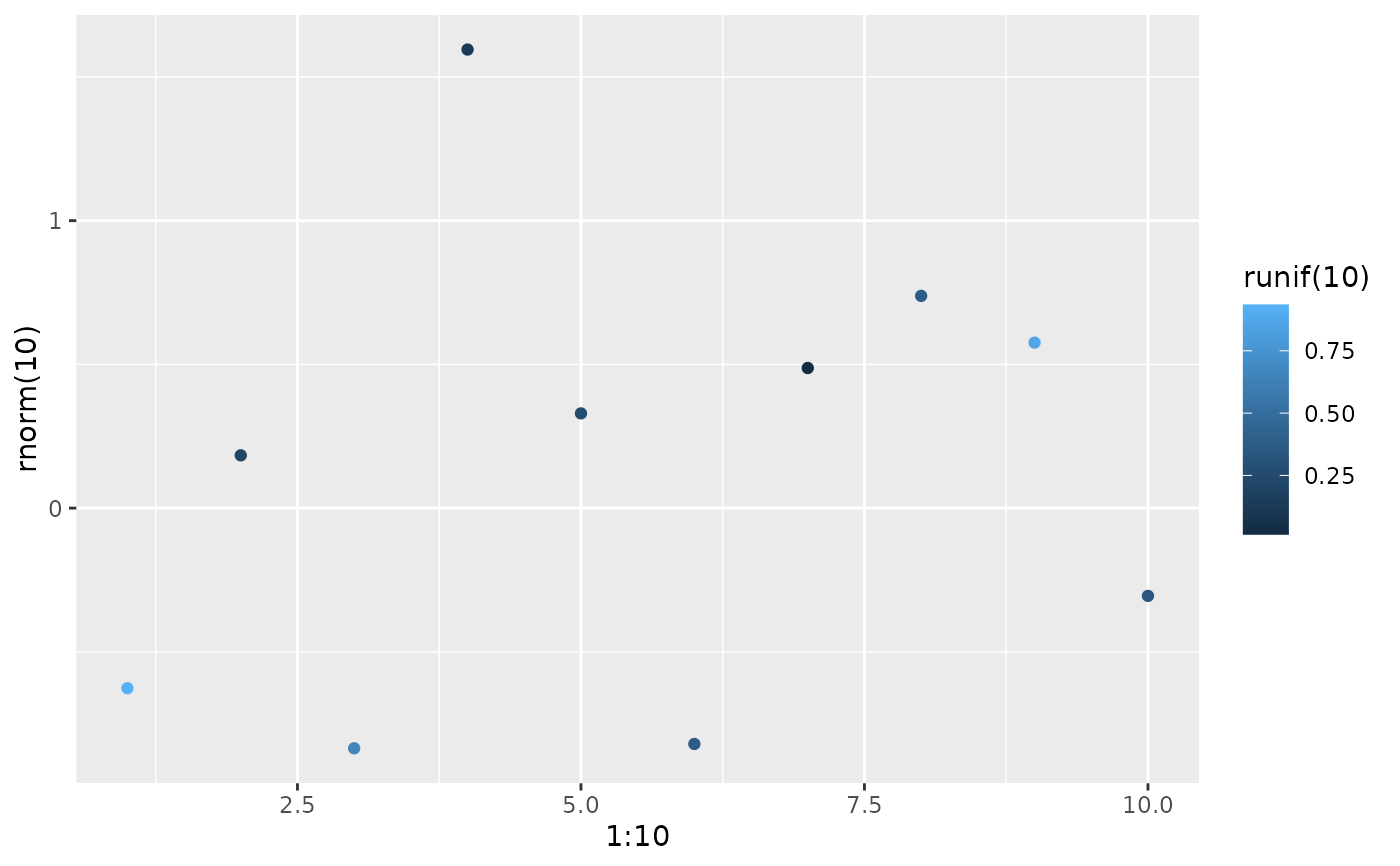
qplot(1:10, rnorm(10), colour = runif(10))
# \donttest{
set.seed(1)
qplot(1:10, rnorm(10), colour = runif(10))
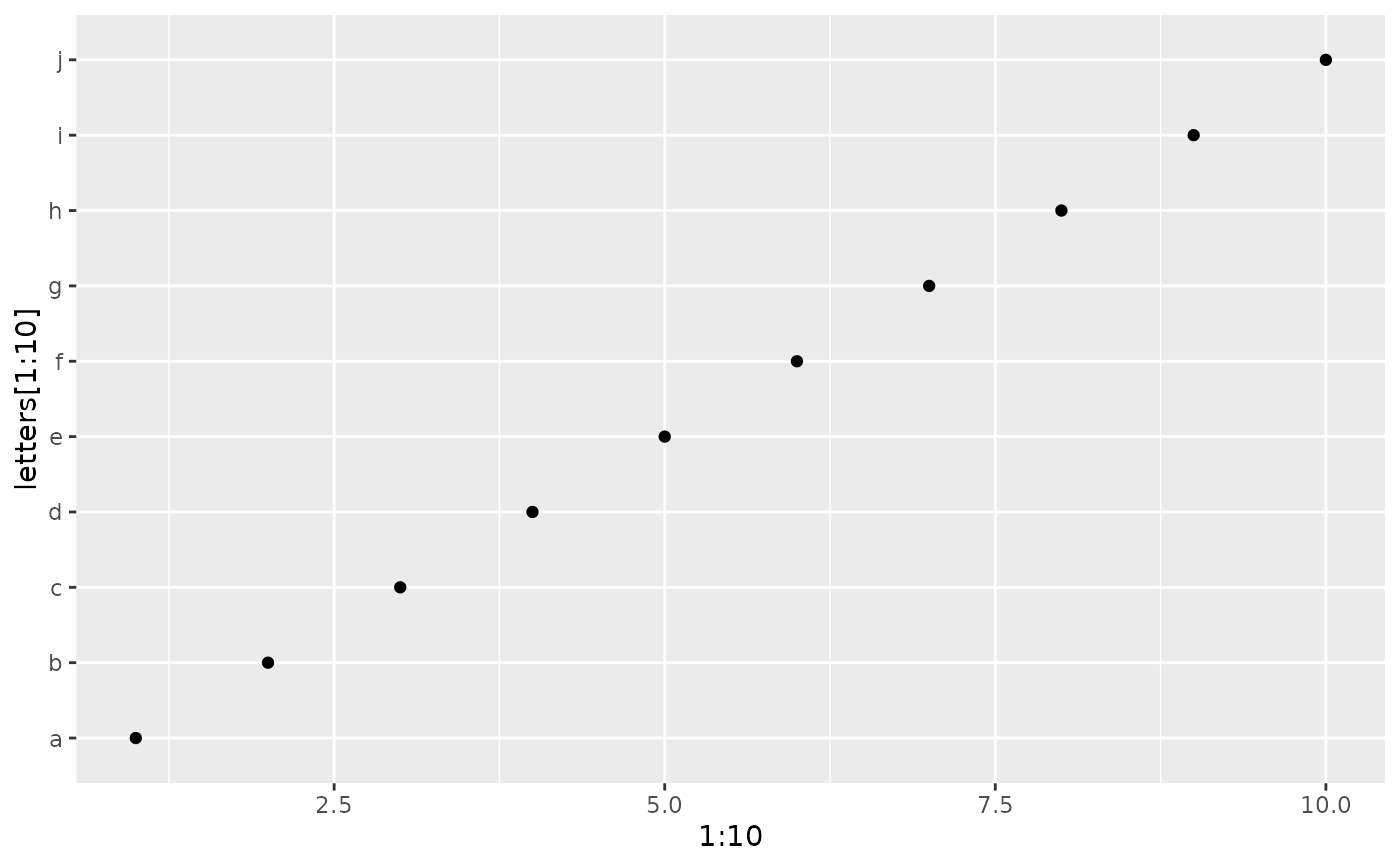
 qplot(1:10, letters[1:10])
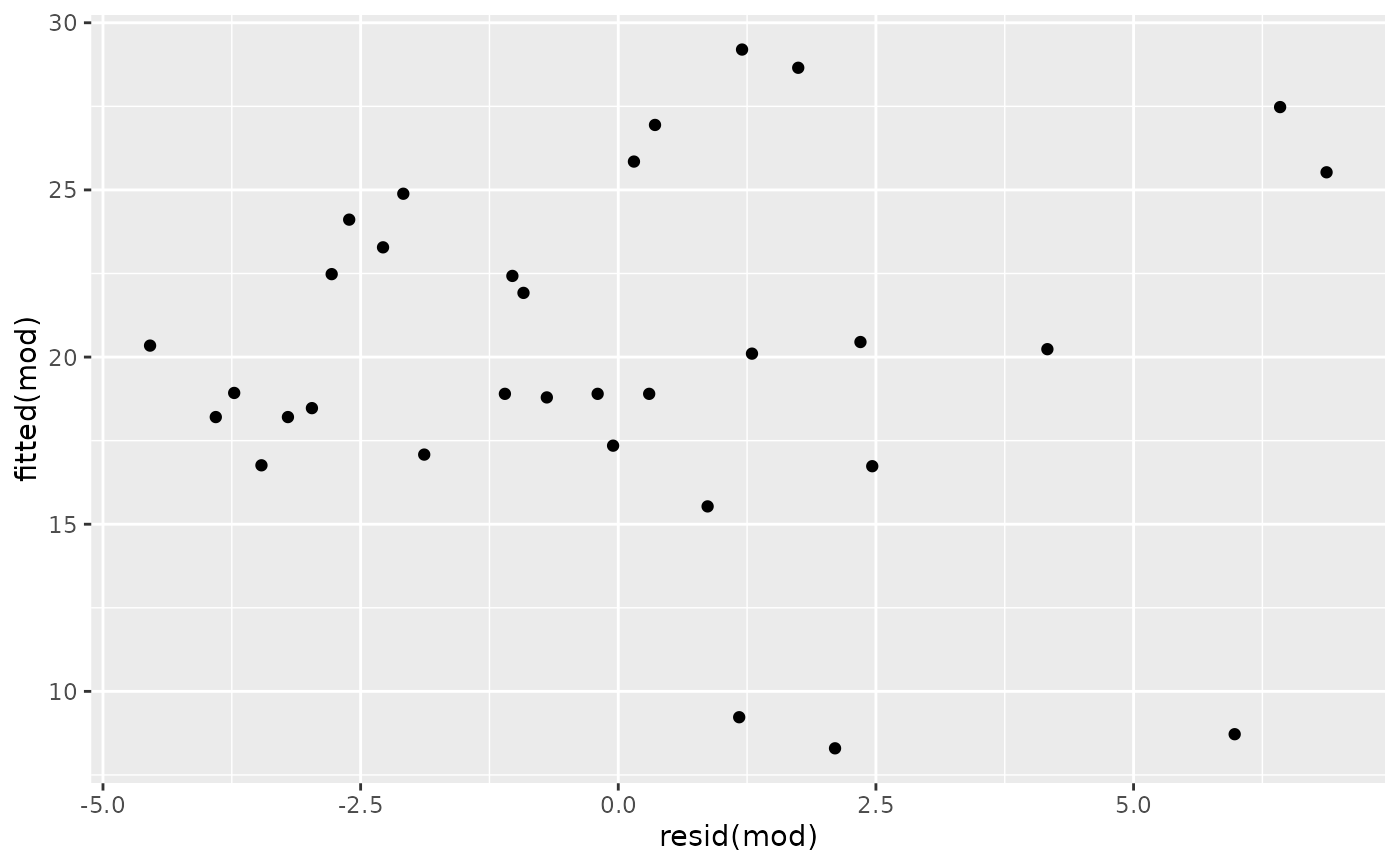
 mod <- lm(mpg ~ wt, data = mtcars)
qplot(resid(mod), fitted(mod))
mod <- lm(mpg ~ wt, data = mtcars)
qplot(resid(mod), fitted(mod))
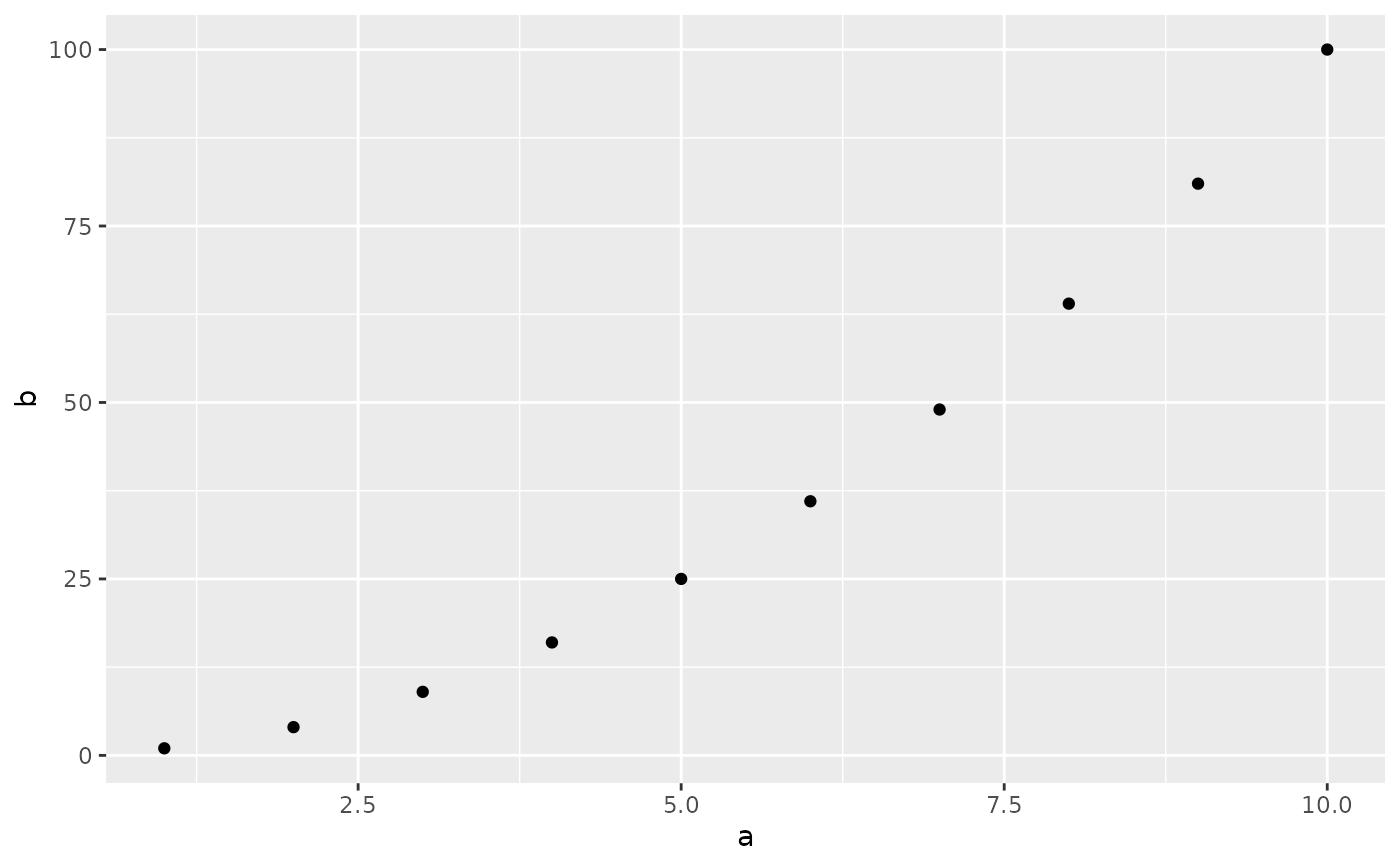
 f <- function() {
a <- 1:10
b <- a ^ 2
qplot(a, b)
}
f()
f <- function() {
a <- 1:10
b <- a ^ 2
qplot(a, b)
}
f()
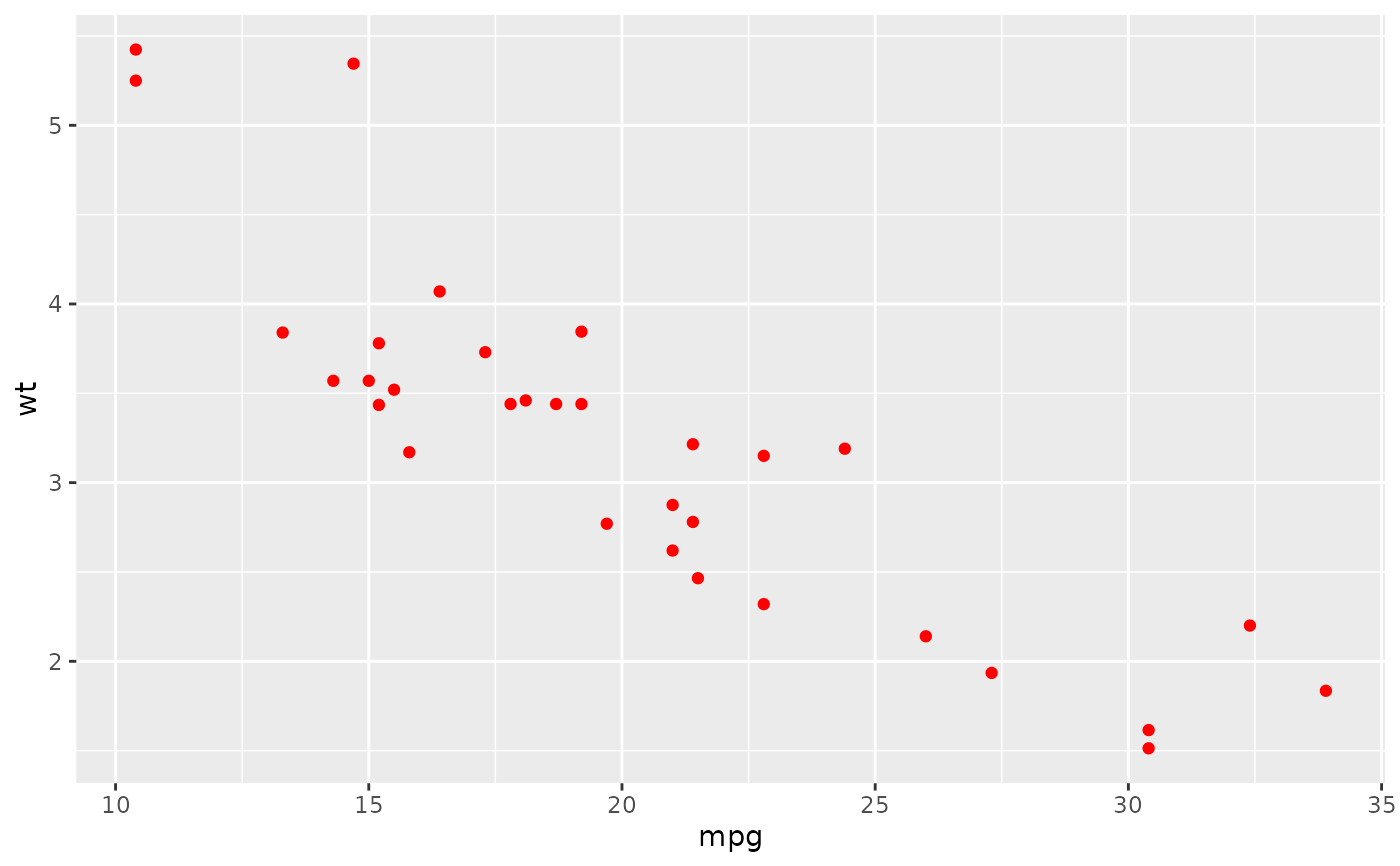
 # To set aesthetics, wrap in I()
qplot(mpg, wt, data = mtcars, colour = I("red"))
# To set aesthetics, wrap in I()
qplot(mpg, wt, data = mtcars, colour = I("red"))
 # qplot will attempt to guess what geom you want depending on the input
# both x and y supplied = scatterplot
qplot(mpg, wt, data = mtcars)
# qplot will attempt to guess what geom you want depending on the input
# both x and y supplied = scatterplot
qplot(mpg, wt, data = mtcars)
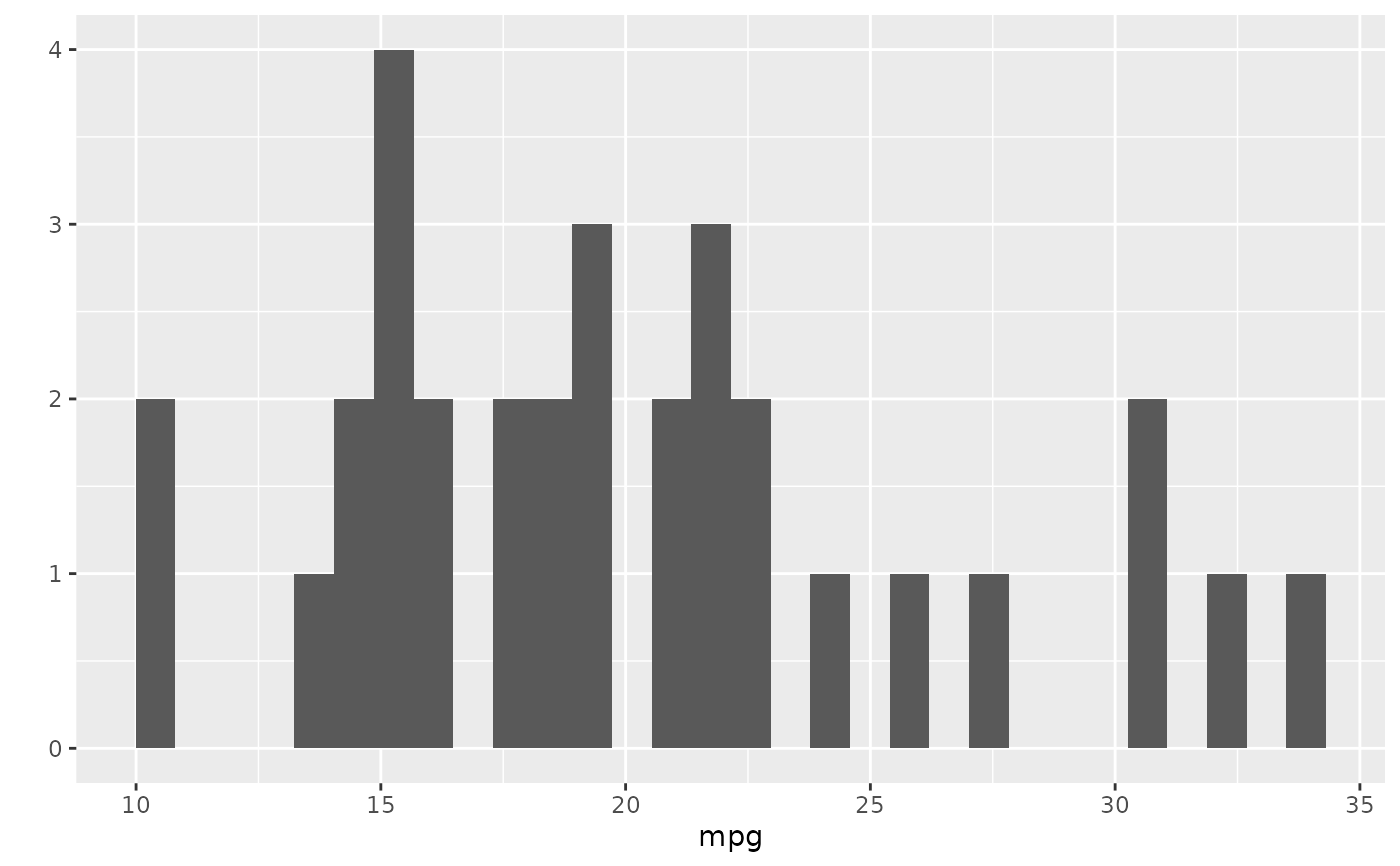
 # just x supplied = histogram
qplot(mpg, data = mtcars)
#> `stat_bin()` using `bins = 30`. Pick better value with `binwidth`.
# just x supplied = histogram
qplot(mpg, data = mtcars)
#> `stat_bin()` using `bins = 30`. Pick better value with `binwidth`.
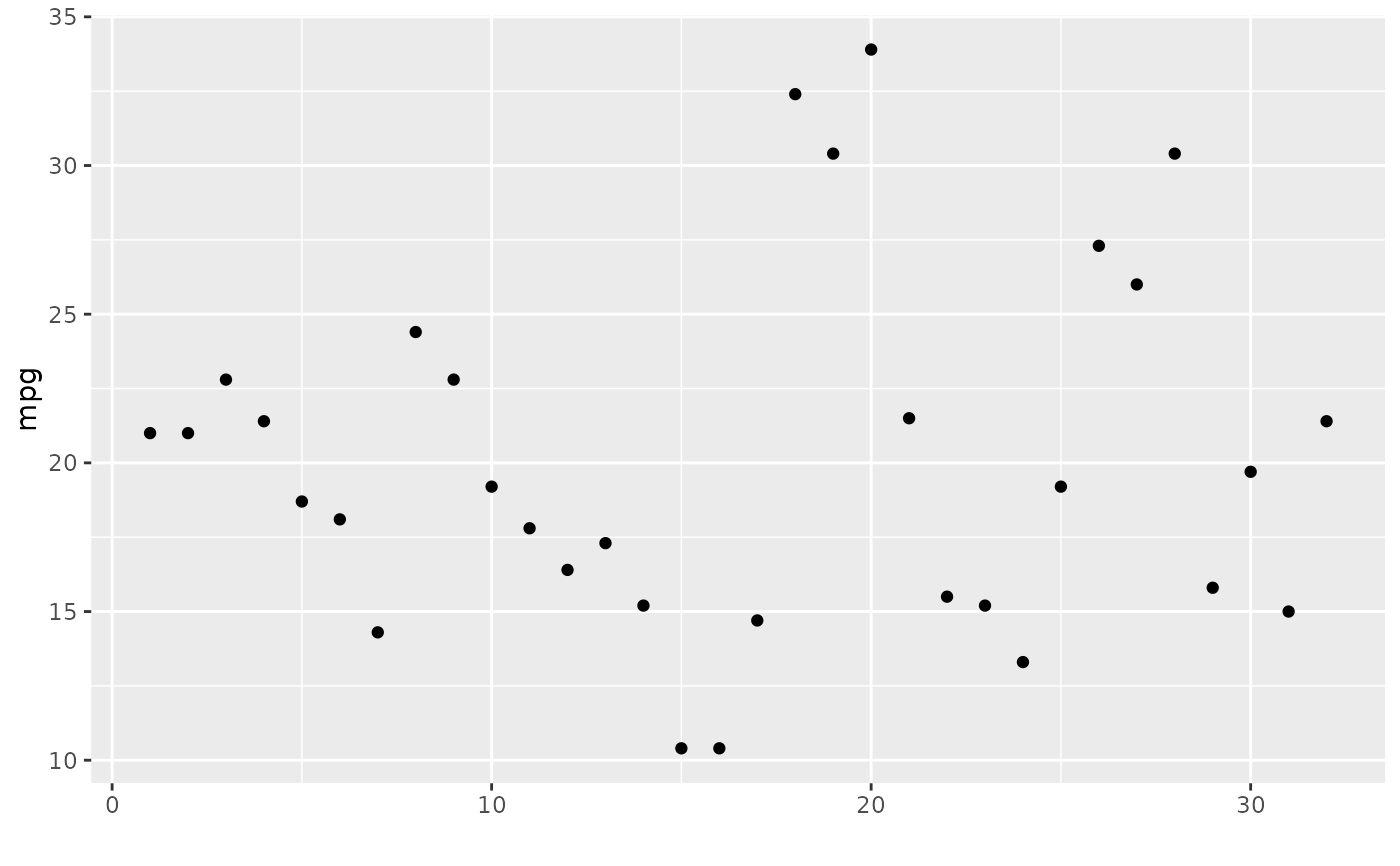
 # just y supplied = scatterplot, with x = seq_along(y)
qplot(y = mpg, data = mtcars)
# just y supplied = scatterplot, with x = seq_along(y)
qplot(y = mpg, data = mtcars)
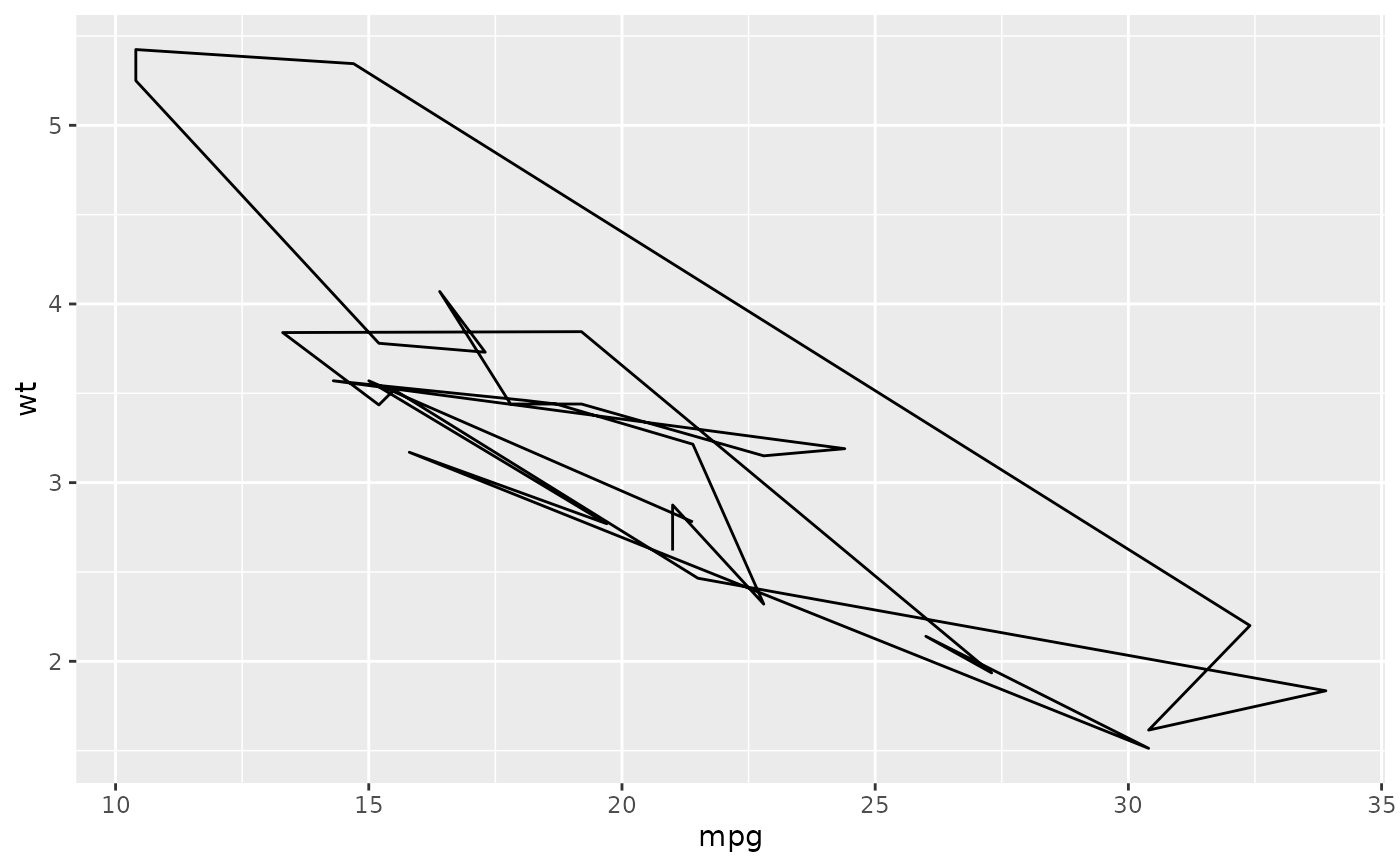
 # Use different geoms
qplot(mpg, wt, data = mtcars, geom = "path")
# Use different geoms
qplot(mpg, wt, data = mtcars, geom = "path")
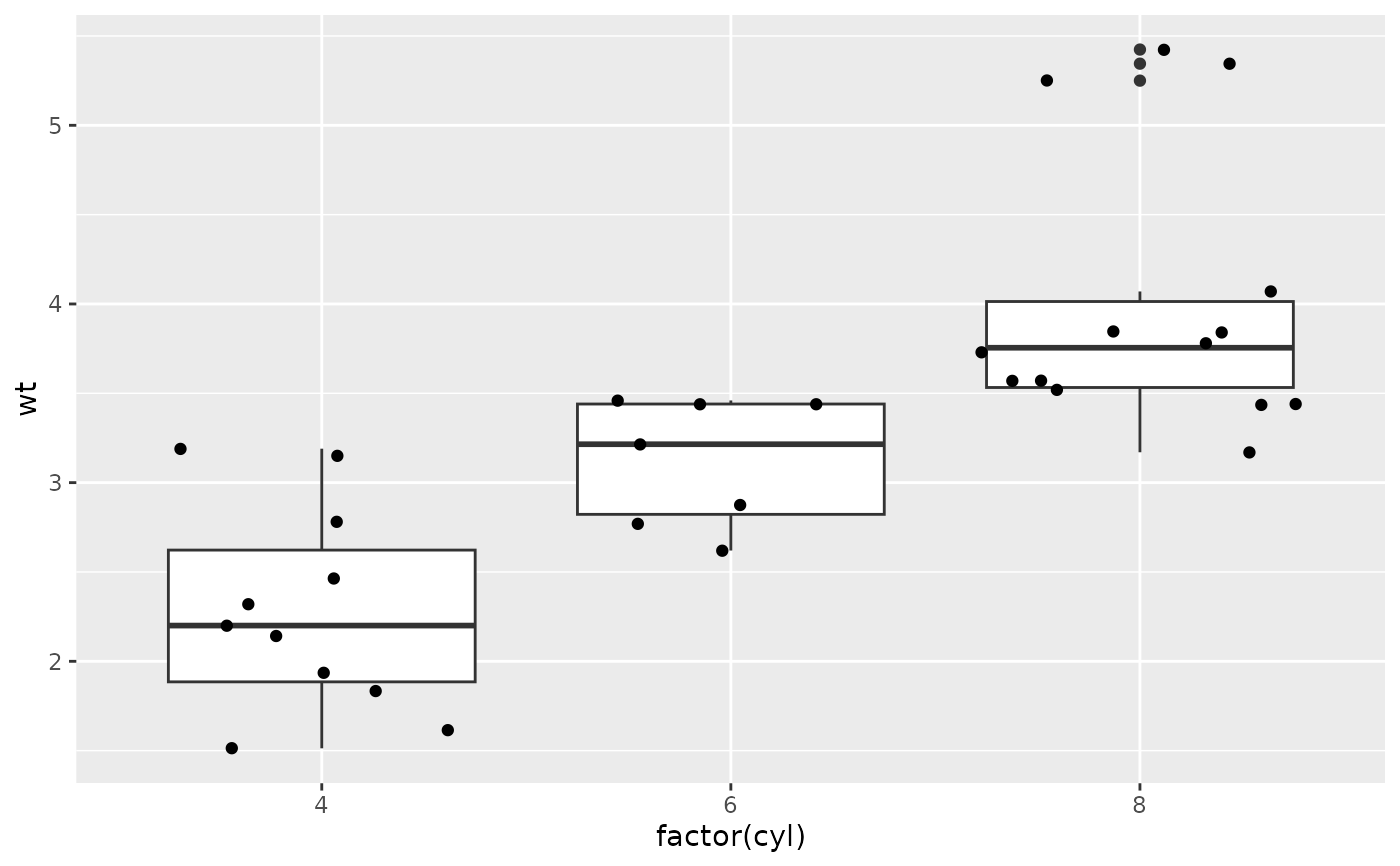
 qplot(factor(cyl), wt, data = mtcars, geom = c("boxplot", "jitter"))
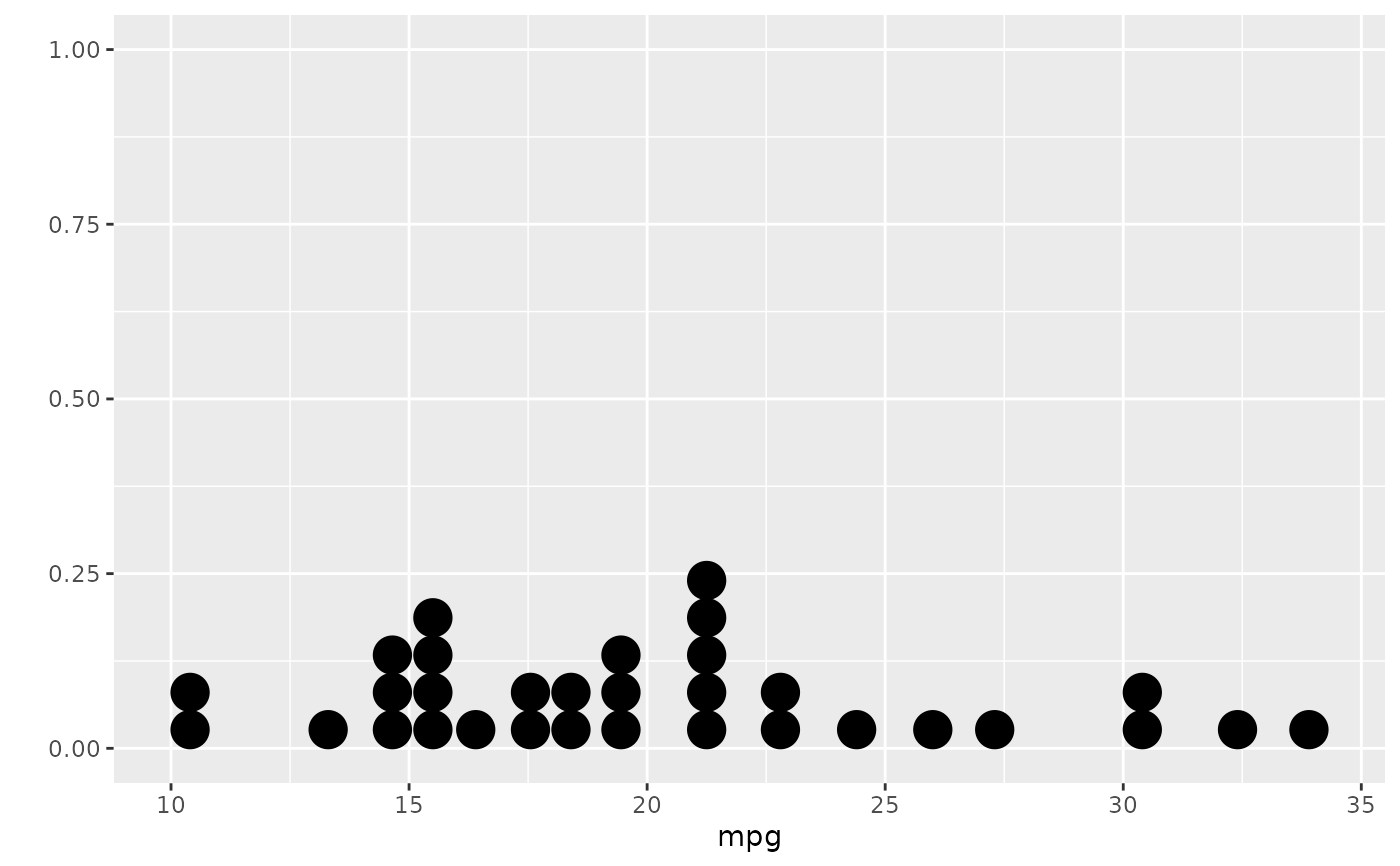
 qplot(mpg, data = mtcars, geom = "dotplot")
#> Bin width defaults to 1/30 of the range of the data. Pick better value
#> with `binwidth`.
qplot(mpg, data = mtcars, geom = "dotplot")
#> Bin width defaults to 1/30 of the range of the data. Pick better value
#> with `binwidth`.
 # }
# }