A rug plot is a compact visualisation designed to supplement a 2d display with the two 1d marginal distributions. Rug plots display individual cases so are best used with smaller datasets.
Usage
geom_rug(
  mapping = NULL,
  data = NULL,
  stat = "identity",
  position = "identity",
  ...,
  outside = FALSE,
  sides = "bl",
  length = unit(0.03, "npc"),
  na.rm = FALSE,
  show.legend = NA,
  inherit.aes = TRUE
)
Arguments
- mapping
Set of aesthetic mappings created by
aes(). If specified andinherit.aes = TRUE(the default), it is combined with the default mapping at the top level of the plot. You must supplymappingif there is no plot mapping.- data
The data to be displayed in this layer. There are three options:
If
NULL, the default, the data is inherited from the plot data as specified in the call toggplot().A
data.frame, or other object, will override the plot data. All objects will be fortified to produce a data frame. Seefortify()for which variables will be created.A
functionwill be called with a single argument, the plot data. The return value must be adata.frame, and will be used as the layer data. Afunctioncan be created from aformula(e.g.~ head(.x, 10)).- stat
The statistical transformation to use on the data for this layer, either as a
ggprotoGeomsubclass or as a string naming the stat stripped of thestat_prefix (e.g."count"rather than"stat_count")- position
Position adjustment, either as a string naming the adjustment (e.g.
"jitter"to useposition_jitter), or the result of a call to a position adjustment function. Use the latter if you need to change the settings of the adjustment.- ...
Other arguments passed on to
layer(). These are often aesthetics, used to set an aesthetic to a fixed value, likecolour = "red"orsize = 3. They may also be parameters to the paired geom/stat.- outside
logical that controls whether to move the rug tassels outside of the plot area. Default is off (FALSE). You will also need to use
coord_cartesian(clip = "off"). When set to TRUE, also consider changing the sides argument to "tr". See examples.- sides
A string that controls which sides of the plot the rugs appear on. It can be set to a string containing any of
"trbl", for top, right, bottom, and left.- length
A
grid::unit()object that sets the length of the rug lines. Use scale expansion to avoid overplotting of data.- na.rm
If
FALSE, the default, missing values are removed with a warning. IfTRUE, missing values are silently removed.- show.legend
logical. Should this layer be included in the legends?
NA, the default, includes if any aesthetics are mapped.FALSEnever includes, andTRUEalways includes. It can also be a named logical vector to finely select the aesthetics to display.- inherit.aes
If
FALSE, overrides the default aesthetics, rather than combining with them. This is most useful for helper functions that define both data and aesthetics and shouldn't inherit behaviour from the default plot specification, e.g.borders().
Details
By default, the rug lines are drawn with a length that corresponds to 3% of the total plot size. Since the default scale expansion of for continuous variables is 5% at both ends of the scale, the rug will not overlap with any data points under the default settings.
Aesthetics
geom_rug() understands the following aesthetics (required aesthetics are in bold):
Learn more about setting these aesthetics in vignette("ggplot2-specs").
Examples
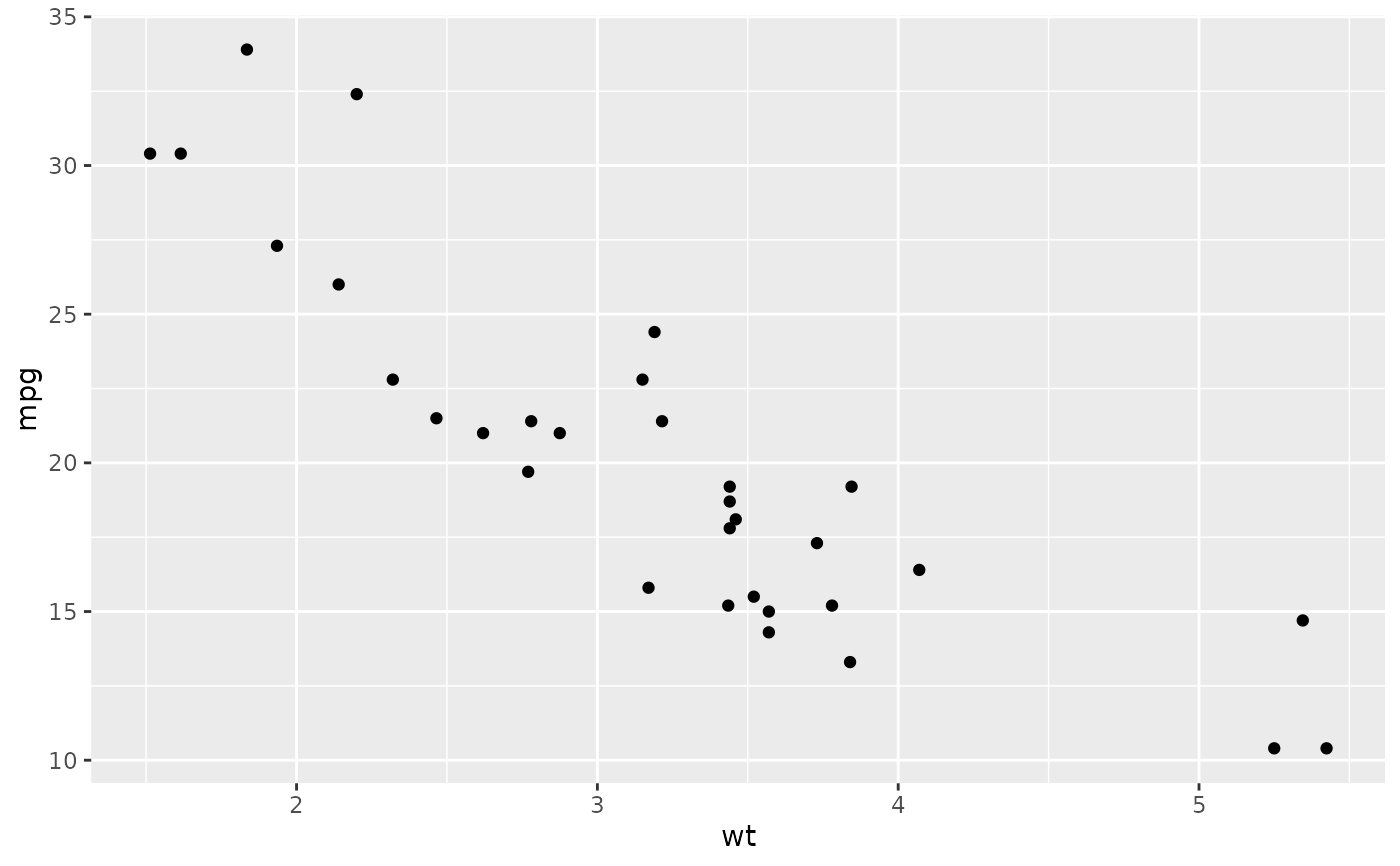
p <- ggplot(mtcars, aes(wt, mpg)) +
geom_point()
p
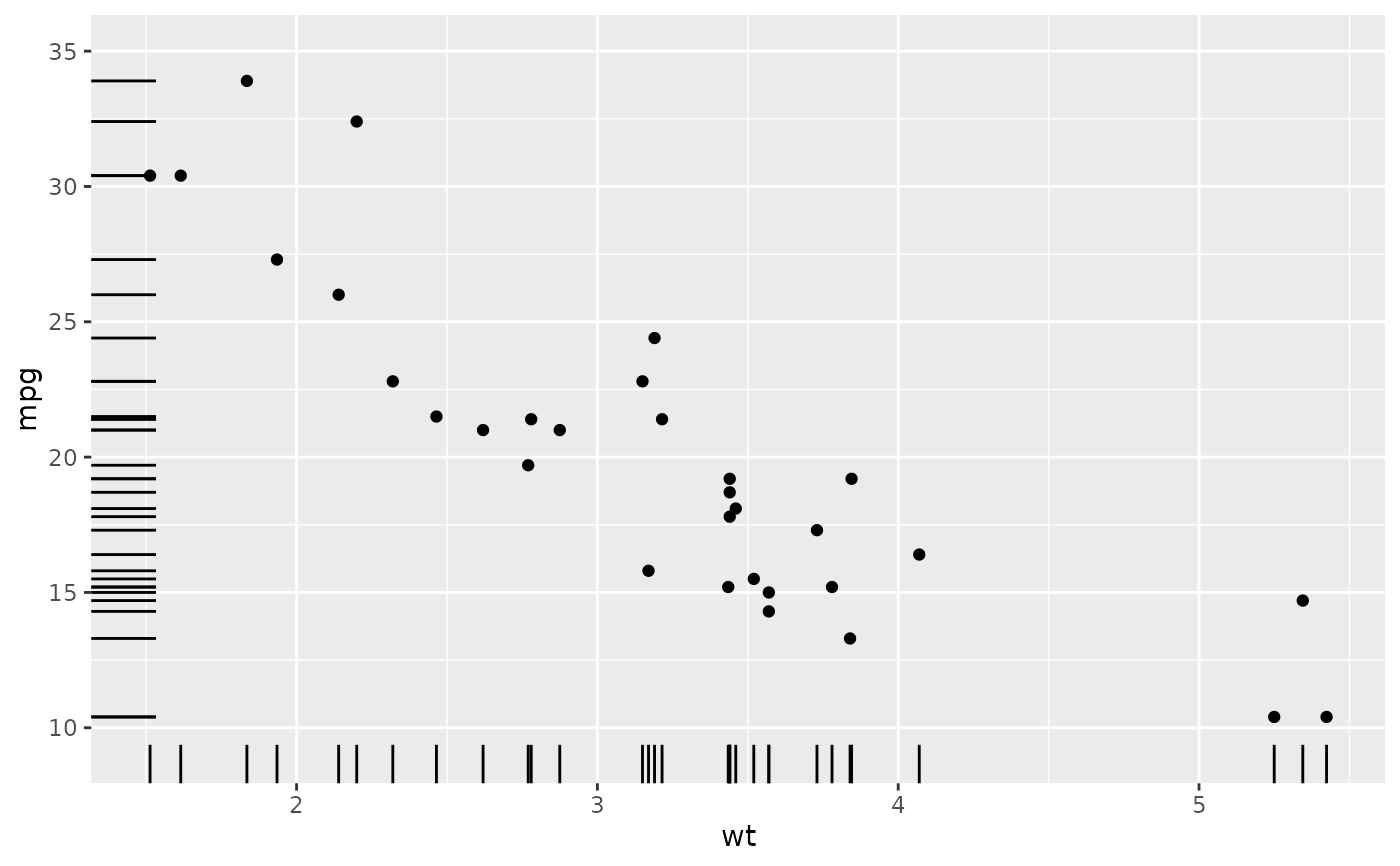
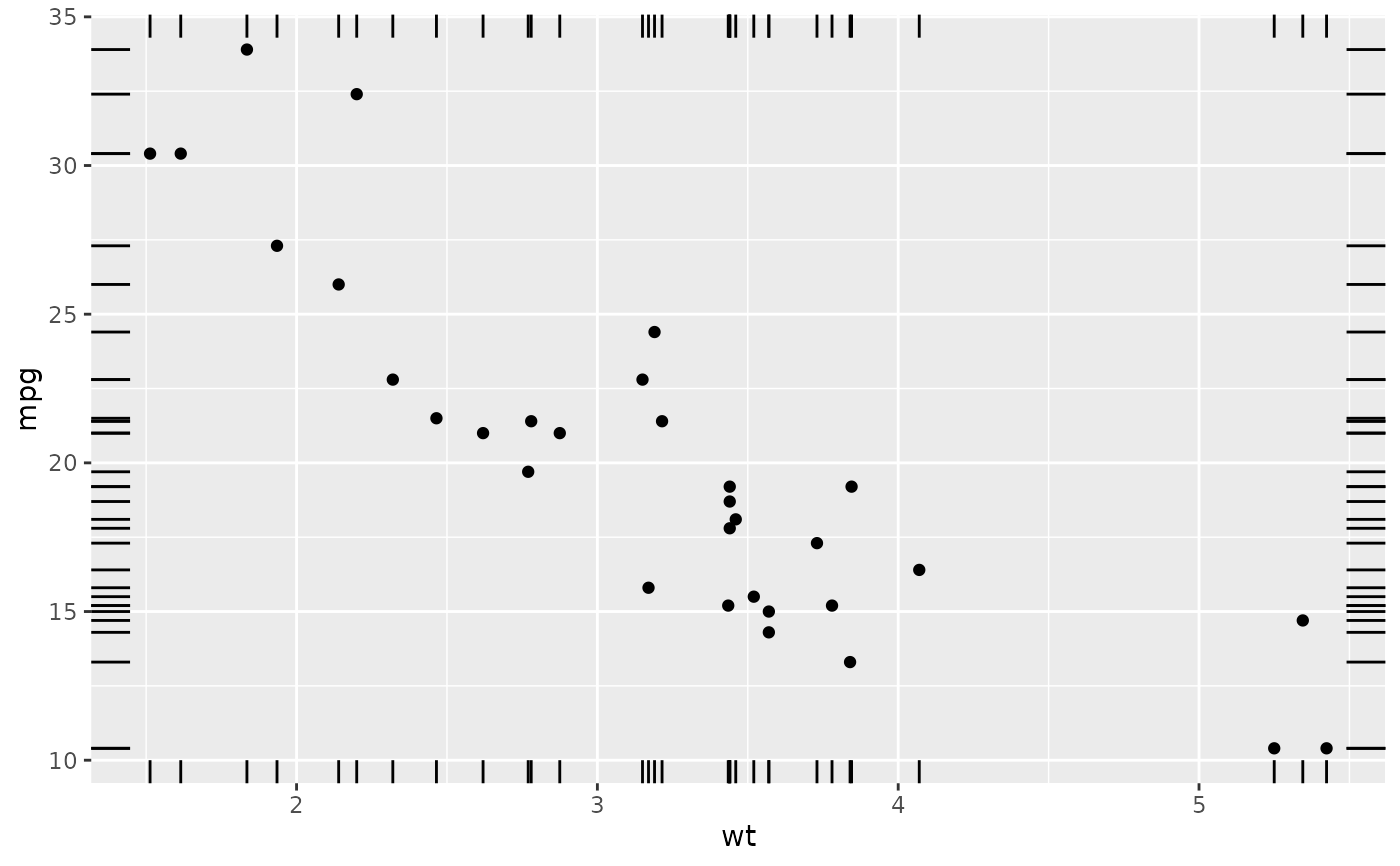
 p + geom_rug()
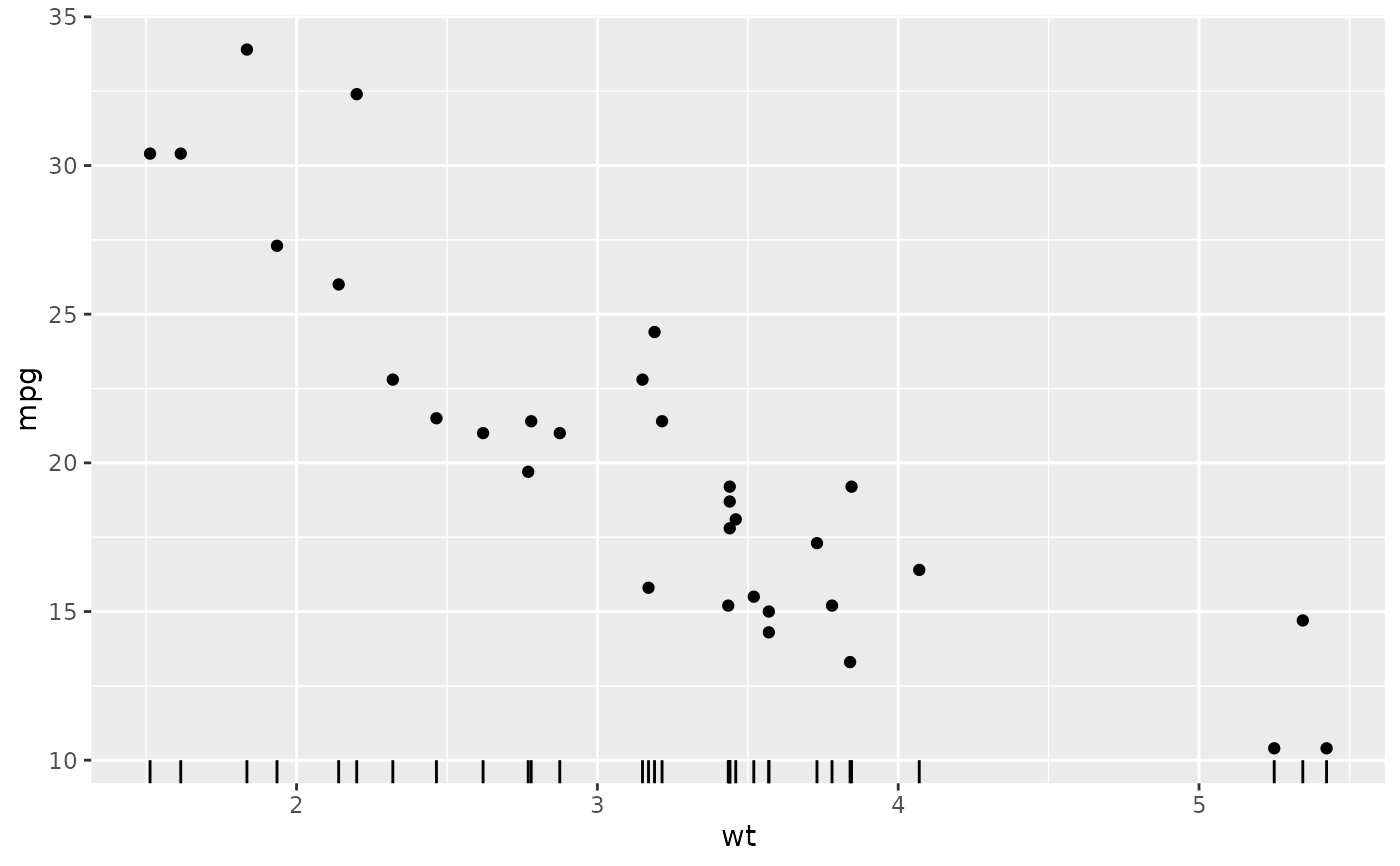
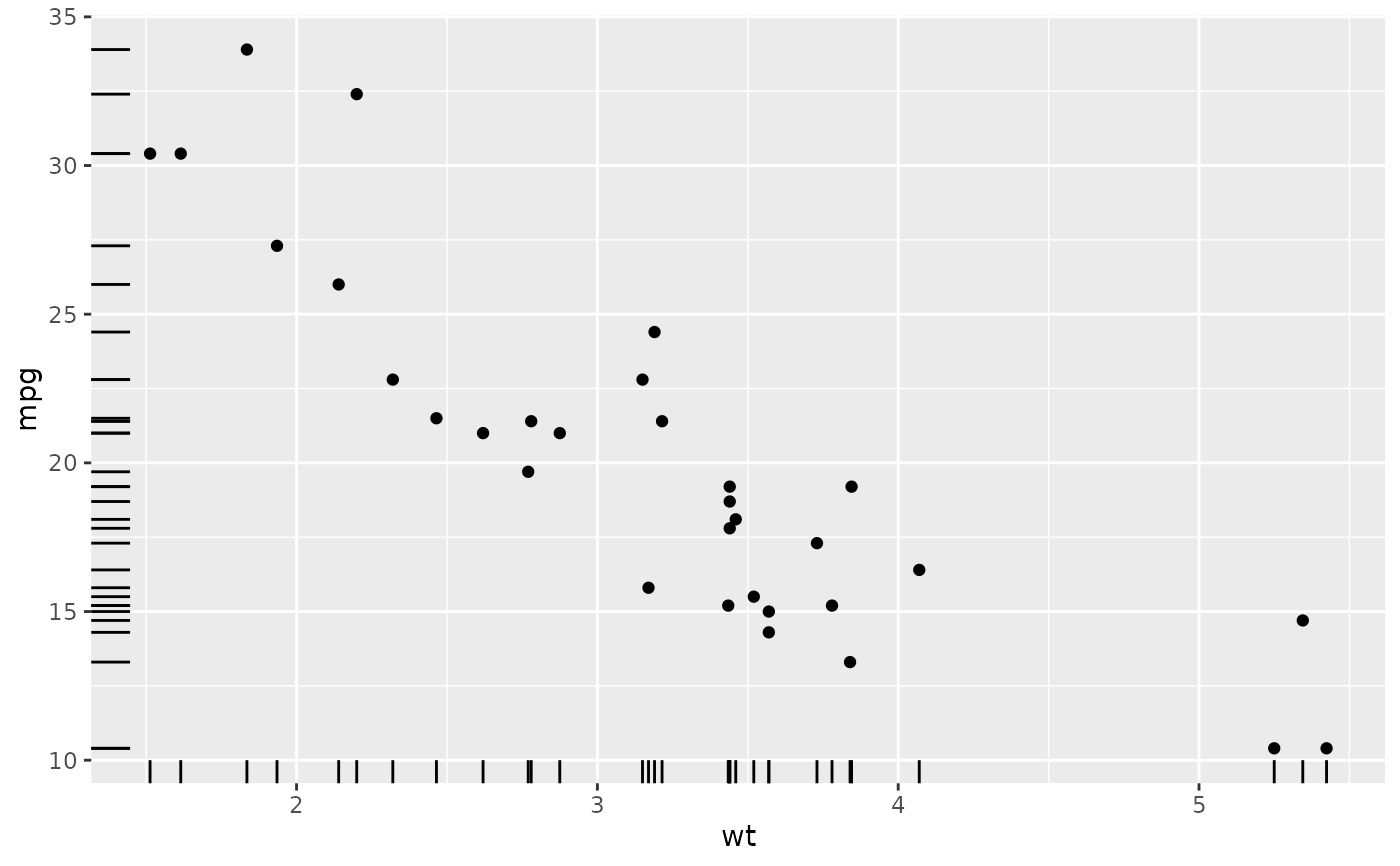 p + geom_rug(sides="b") # Rug on bottom only
 p + geom_rug(sides="trbl") # All four sides
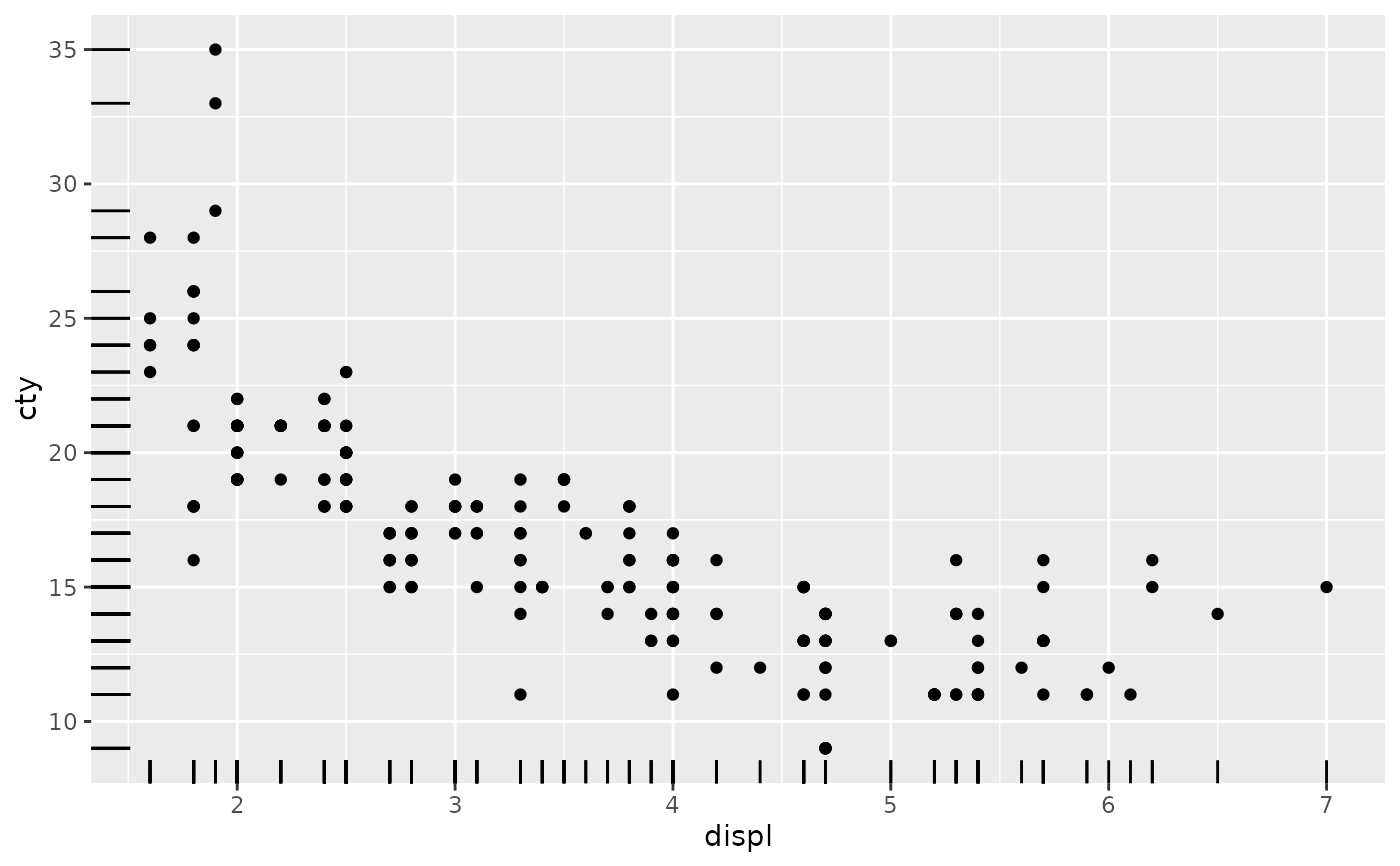
 # Use jittering to avoid overplotting for smaller datasets
ggplot(mpg, aes(displ, cty)) +
geom_point() +
geom_rug()
# Use jittering to avoid overplotting for smaller datasets
ggplot(mpg, aes(displ, cty)) +
geom_point() +
geom_rug()
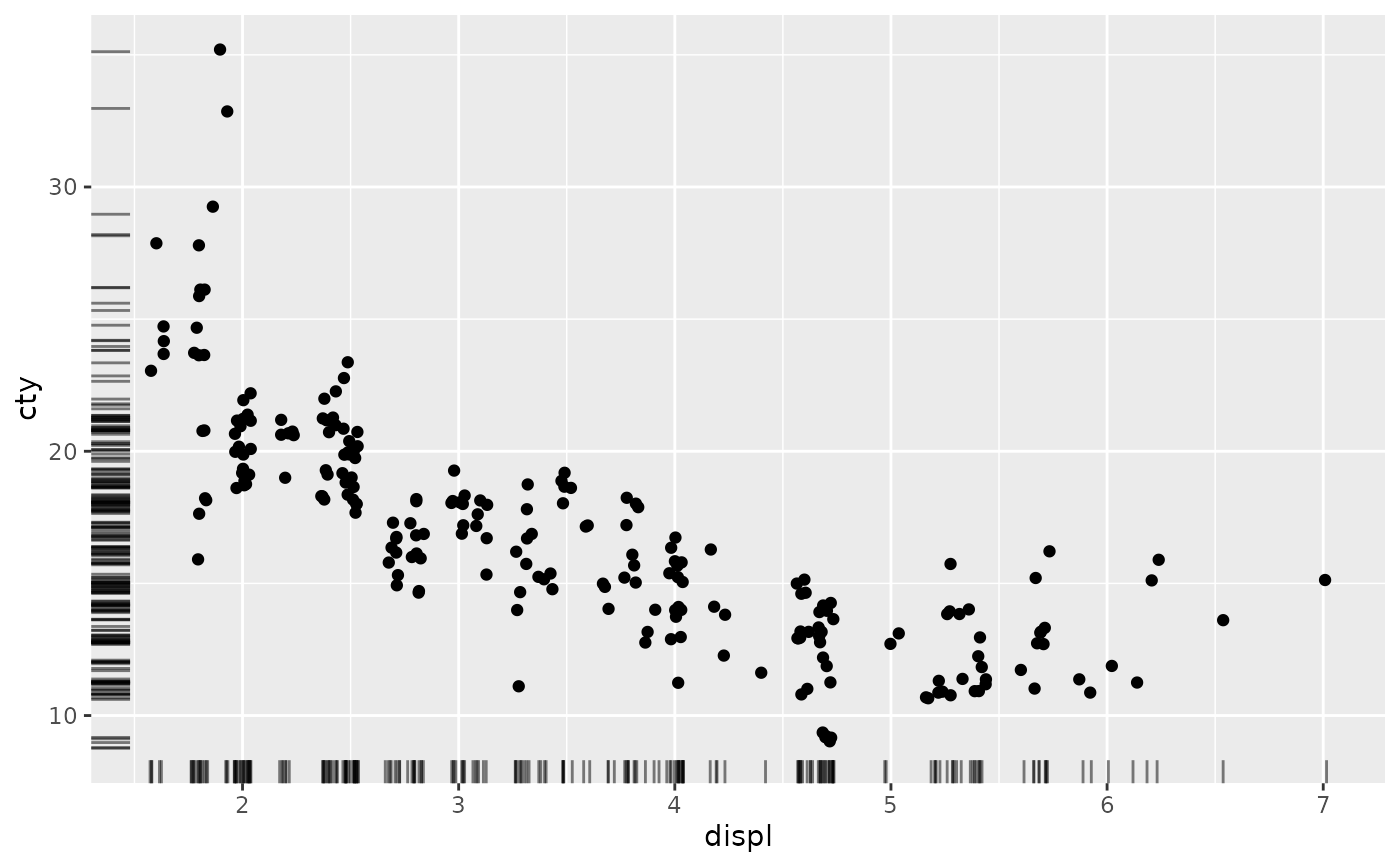
 ggplot(mpg, aes(displ, cty)) +
geom_jitter() +
geom_rug(alpha = 1/2, position = "jitter")
ggplot(mpg, aes(displ, cty)) +
geom_jitter() +
geom_rug(alpha = 1/2, position = "jitter")
 # move the rug tassels to outside the plot
# remember to set clip = "off".
p +
geom_rug(outside = TRUE) +
coord_cartesian(clip = "off")
# move the rug tassels to outside the plot
# remember to set clip = "off".
p +
geom_rug(outside = TRUE) +
coord_cartesian(clip = "off")
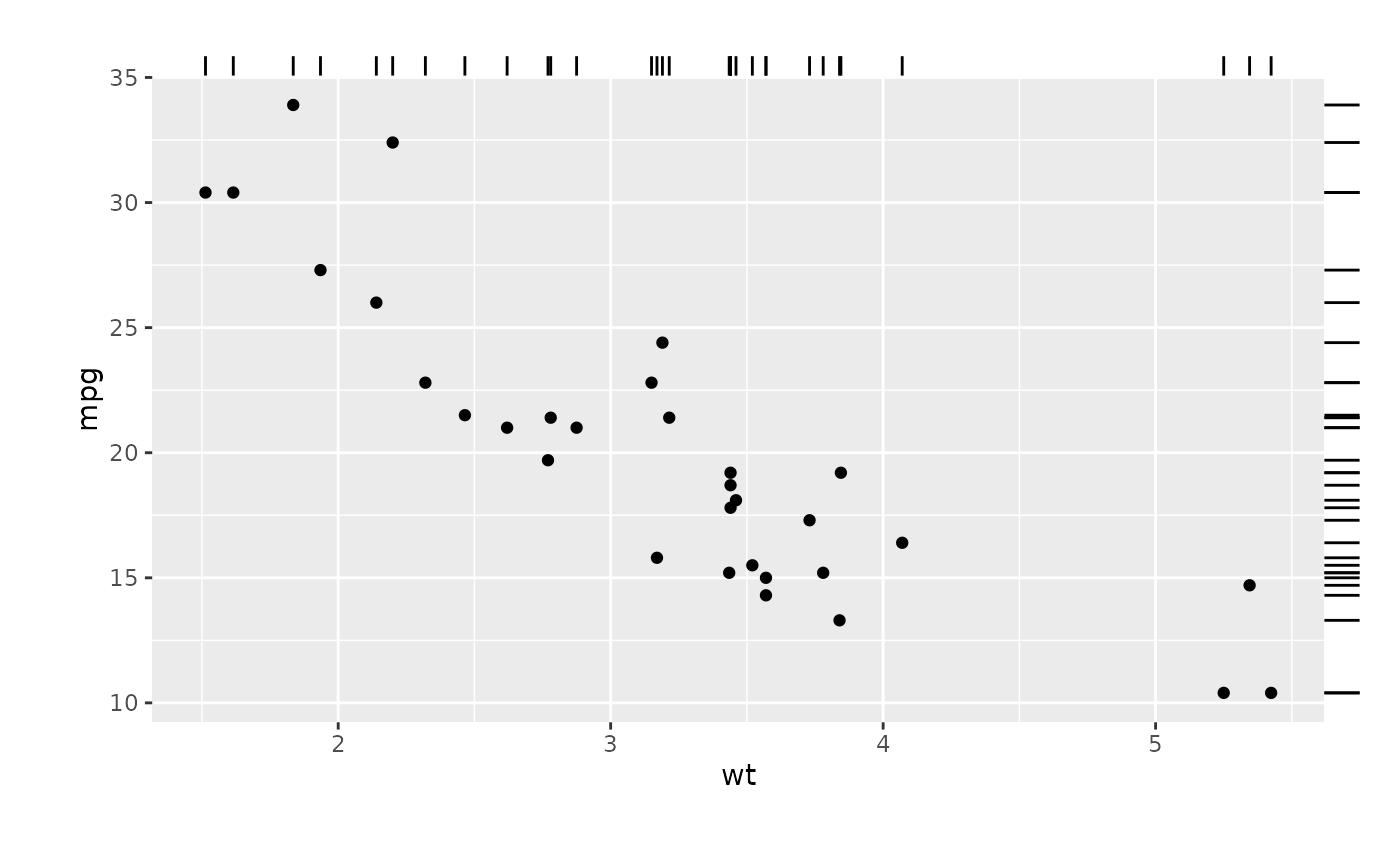
 # set sides to top right, and then move the margins
p +
geom_rug(outside = TRUE, sides = "tr") +
coord_cartesian(clip = "off") +
theme(plot.margin = margin(1, 1, 1, 1, "cm"))
# set sides to top right, and then move the margins
p +
geom_rug(outside = TRUE, sides = "tr") +
coord_cartesian(clip = "off") +
theme(plot.margin = margin(1, 1, 1, 1, "cm"))
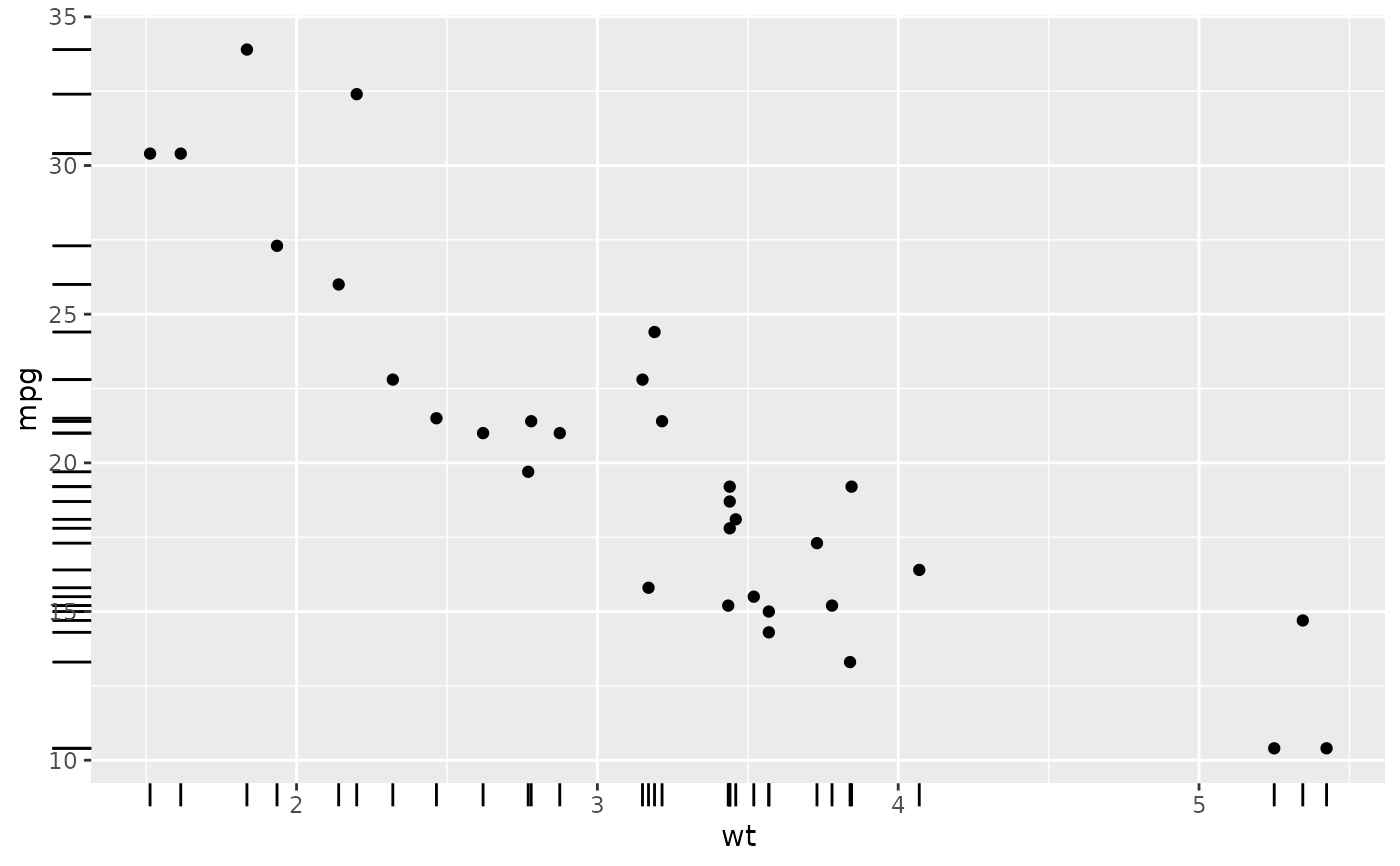
 # increase the line length and
# expand axis to avoid overplotting
p +
geom_rug(length = unit(0.05, "npc")) +
scale_y_continuous(expand = c(0.1, 0.1))
# increase the line length and
# expand axis to avoid overplotting
p +
geom_rug(length = unit(0.05, "npc")) +
scale_y_continuous(expand = c(0.1, 0.1))